John Deere 2011 Annual Report Download - page 12
Download and view the complete annual report
Please find page 12 of the 2011 John Deere annual report below. You can navigate through the pages in the report by either clicking on the pages listed below, or by using the keyword search tool below to find specific information within the annual report.-
 1
1 -
 2
2 -
 3
3 -
 4
4 -
 5
5 -
 6
6 -
 7
7 -
 8
8 -
 9
9 -
 10
10 -
 11
11 -
 12
12 -
 13
13 -
 14
14 -
 15
15 -
 16
16 -
 17
17 -
 18
18 -
 19
19 -
 20
20 -
 21
21 -
 22
22 -
23
-
24
-
25
-
26
-
27
-
28
-
29
-
30
-
31
-
32
-
33
-
34
-
35
-
36
-
37
-
38
-
39
-
40
-
41
-
42
-
43
-
44
-
45
-
46
-
47
-
48
-
49
-
50
-
51
-
52
-
53
-
54
-
55
-
56
-
57
-
58
-
59
-
60
 |
 |

MANAGEMENT’S DISCUSSION AND ANALYSIS
RESULTS OF OPERATIONS FOR THE YEARS ENDED
OCTOBER 31, 2011, 2010 AND 2009
OVERVIEW
Organization
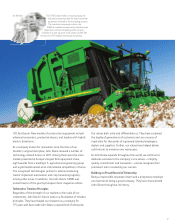
The company’s equipment operations generate revenues and
cash primarily from the sale of equipment to John Deere dealers
and distributors. The equipment operations manufacture and
distribute a full line of agricultural equipment; a variety of
commercial, consumer and landscapes equipment and products;
and a broad range of equipment for construction and forestry.
The company’s financial services primarily provide credit
services, which mainly finance sales and leases of equipment
by John Deere dealers and trade receivables purchased from
the equipment operations. In addition, financial services
offer crop risk mitigation products and extended equipment
warranties. The information in the following discussion is
presented in a format that includes information grouped as
consolidated, equipment operations and financial services.
The company’s operating segments consist of agriculture
and turf, construction and forestry, and financial services.
The previous credit segment and the “Other” segment were
combined into the financial services segment at the beginning
of the first quarter of 2011 (see Note 28). The “Other” segment
consisted of an insurance business related to extended warranty
policies for equipment that did not meet the materiality
threshold of reporting. The following discussions of operating
segment results and liquidity ratios have been revised to
conform to the current segments.
Trends and Economic Conditions
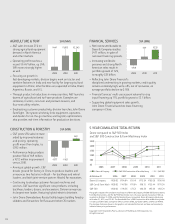
Industry farm machinery sales in the U.S. and Canada for 2012
are forecast to be up approximately 5 to 10 percent, compared
to 2011. Industry sales in the EU 27 nations of Western and
Central Europe are forecast to be about the same in 2012, while
sales in the Commonwealth of Independent States are expected
to be moderately higher. Sales in Asia are forecast to increase
strongly again in 2012. South American industry sales are
projected to be approximately the same as 2011. Industry sales
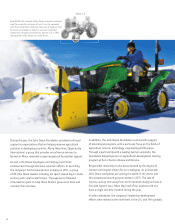
of turf and utility equipment in the U.S. and Canada are
expected to increase slightly. The company’s agriculture and turf
equipment sales increased 21 percent in 2011 and are forecast to
increase by about 15 percent for 2012. Construction equipment
markets are forecast to slightly improve, while global forestry
markets are expected to be about the same in 2012. The compa-
ny’s construction and forestry sales increased 45 percent in
2011 and are forecast to increase by about 16 percent in 2012.
Net income of the company’s financial services operations
attributable to Deere & Company in 2012 is forecast to be
approximately $450 million.
Items of concern include the uncertainty of the global
economic recovery, the impact of sovereign and state debt,
capital market disruptions, the availability of credit for the
company’s customers and suppliers, the effectiveness of
governmental actions in respect to monetary policies, general
economic conditions and financial regulatory reform.
Significant volatility in the price of many commodities could
also impact the company’s results, while the availability of
certain components that could impact the company’s ability to
meet production schedules continues to be monitored.
Designing and producing products with engines that continue
to meet high performance standards and increasingly stringent
emissions regulations is one of the company’s major priorities.
Supported by record 2011 performance, the company
remains well positioned to implement its growth plans and
capitalize on positive long-term economic trends. The company’s
strong levels of cash flow are funding growth throughout the
world and are being shared with investors in the form of
dividends and share repurchases.
2011 COMPARED WITH 2010
CONSOLIDATED RESULTS
Worldwide net income attributable to Deere & Company in
2011 was $2,800 million, or $6.63 per share diluted ($6.71
basic), compared with $1,865 million, or $4.35 per share
diluted ($4.40 basic), in 2010. Net sales and revenues increased
23 percent to $32,013 million in 2011, compared with
$26,005 million in 2010. Net sales of the equipment operations
increased 25 percent in 2011 to $29,466 million from $23,573
million last year. The sales increase, which was primarily due to
higher shipment volumes, also included a favorable effect for
foreign currency translation of 3 percent and price realization
of 3 percent. Net sales in the U.S. and Canada increased
17 percent in 2011. Net sales outside the U.S. and Canada
increased by 38 percent in 2011, which included a favorable
effect of 7 percent for foreign currency translation.
Worldwide equipment operations had an operating profit
of $3,839 million in 2011, compared with $2,909 million in
2010. The higher operating profit was primarily due to higher
shipment volumes and improved price realization, partially
offset by increased raw material costs, higher manufacturing
overhead costs related to new products, higher selling,
administrative and general expenses and increased research and
development expenses.
The equipment operations’ net income was $2,329 million
in 2011, compared with $1,492 million in 2010. The same
operating factors mentioned above and a lower effective tax rate
in 2011 affected these results.
Net income of the financial services operations attribut-
able to Deere & Company in 2011 increased to $471 million,
compared with $373 million in 2010. The increase was
primarily a result of growth in the credit portfolio and a lower
provision for credit losses. Additional information is presented
in the following discussion of the “Worldwide Financial
Services Operations.”
The cost of sales to net sales ratio for 2011 was 74.4 percent,
compared with 73.8 percent last year. The increase was primarily
due to increased raw material costs and higher manufacturing
overhead costs related to new products, partially offset by
improved price realization.
Finance and interest income increased this year due to a
larger average credit portfolio, partially offset by lower financing
rates. Other income increased primarily as a result of higher
insurance premiums and fees earned on crop insurance, largely
offset by lower service revenues due to the sale of the wind
12