Jack In The Box 2008 Annual Report Download - page 2
Download and view the complete annual report
Please find page 2 of the 2008 Jack In The Box annual report below. You can navigate through the pages in the report by either clicking on the pages listed below, or by using the keyword search tool below to find specific information within the annual report.-
 1
1 -
 2
2 -
 3
3 -
 4
4 -
 5
5 -
 6
6 -
 7
7 -
 8
8 -
 9
9 -
 10
10 -
 11
11 -
 12
12 -
 13
13 -
14
-
15
-
16
-
17
-
18
-
19
-
20
-
21
-
22
-
23
-
24
-
25
-
26
-
27
-
28
-
29
-
30
-
31
-
32
-
33
-
34
-
35
-
36
-
37
-
38
-
39
-
40
-
41
-
42
-
43
-
44
-
45
-
46
-
47
-
48
-
49
-
50
-
51
-
52
-
53
-
54
-
55
-
56
-
57
-
58
-
59
-
60
-
61
-
62
-
63
-
64
-
65
-
66
-
67
-
68
-
69
-
70
-
71
-
72
-
73
-
74
-
75
-
76
-
77
-
78
-
79
-
80
-
81
-
82
-
83
-
84
-
85
-
86
-
87
-
88
 |
 |

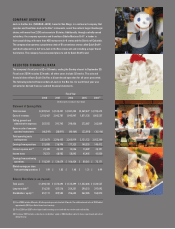
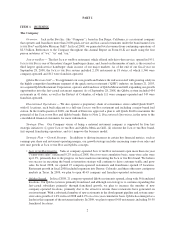
COMPANY OVERVIEW
Jack in the Box Inc. (NASDAQ: JACK), based in San Diego, is a restaurant company that
operates and franchises Jack in the Box®restaurants, one of the nation’s largest hamburger
chains, with more than 2,100 restaurants in 18 states. Additionally, through a wholly owned
subsidiary, the company operates and franchises Qdoba Mexican Grill®, a leader in
fast-casual dining, with more than 450 restaurants in 41 states and the District of Columbia.
The company also operates a proprietary chain of 61 convenience stores called Quick Stuff®,
each built adjacent to a full-size Jack in the Box restaurant and including a major-brand
fuel station. The company has announced plans to sell its Quick Stuff brand.
SELECTED FINANCIAL DATA
The company’s fiscal year is 52 or 53 weeks, ending the Sunday closest to September 30.
Fiscal year 2004 includes 53 weeks; all other years include 52 weeks. The selected
financial data reflects Quick Stuff as a discontinued operation for all years presented.
The following selected financial data of Jack in the Box Inc. for each fiscal year was
extracted or derived from our audited financial statements.
Fiscal Year
2008 2007 2006 2005 2004
(1)
(In thousands, except per share data)
Statement of Earnings Data:
Total revenues
$2,539,561 $2,513,431 $2,381,244 $2,269,477 $2,192,612
Costs of revenues
2,102,467 2,042,781 1,945,947 1,871,128 1,805,537
Selling, general and
administrative expenses
287,555 291,745 298,436 272,087 262,809
Gains on sale of company-
operated restaurants
(66,349) (38,091) (40,464) (22,093) (16,146)
Total operating costs
and expenses
2,323,673 2,296,435 2,203,919 2,121,122 2,052,200
Earnings from operations
215,888 216,996 177,325 148,355 140,412
Interest expense, net(2)
27,428 23,335 12,056 13,389 25,391
Income taxes
70,251 68,982 58,845 45,405 41,850
Earnings from continuing
operations
$ 118,209 $ 124,679 $ 106,424 $ 89,561 $ 73,171
Diluted earnings per share
from continuing operations
$ 1.99 $ 1.85 $ 1.48 $ 1.21 $ 0.99
Balance Sheet Data (at end of period):
Total assets
$ 1,498,418 $ 1,374,690 $ 1,513,499 $ 1,332,606 $ 1,320,527
Long-term debt(2)
516,250 427,516 254,231 290,213 297,092
Stockholders’ equity(3)
457,111 409,585 706,633 562,085 550,870
(1) Fiscal 2004 includes 53 weeks. All other periods presented include 52 weeks. The additional week in fiscal 2004 added
approximately $0.01 per diluted share to net earnings.
(2) Fiscal 2008 and 2007 reflect higher bank borrowings associated with our revolver and credit facility.
(3) Fiscal year 2007 includes a reduction in stockholders’ equity of $363.4 million related to shares repurchased and retired
during the year.