ING Direct 2006 Annual Report Download - page 3
Download and view the complete annual report
Please find page 3 of the 2006 ING Direct annual report below. You can navigate through the pages in the report by either clicking on the pages listed below, or by using the keyword search tool below to find specific information within the annual report.-
 1
1 -
 2
2 -
 3
3 -
 4
4 -
 5
5 -
 6
6 -
 7
7 -
 8
8 -
 9
9 -
 10
10 -
 11
11 -
 12
12 -
 13
13 -
 14
14 -
15
-
16
-
17
-
18
-
19
-
20
-
21
-
22
-
23
-
24
-
25
-
26
-
27
-
28
-
29
-
30
-
31
-
32
-
33
-
34
-
35
-
36
 |
 |

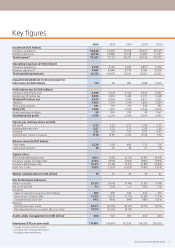
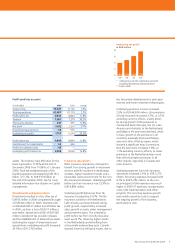
2006 2005 2004 2003(1) 2002(1)
Income (in EUR million)
Insurance operations 59,642 57,403 55,614 53,223 59,729
Banking operations 14,195 13,848 12,678 11,680 11,201
Total income(2) 73,621 71,120 68,171 64,736 70,913
Operating expenses (in EUR million)
Insurance operations 5,275 5,195 4,746 4,897 5,203
Banking operations(3) 9,087 8,844 8,795 8,184 8,298
Total operating expenses 14,362 14,039 13,541 13,081 13,501
Impairments/additions to the provision for
loan losses (in EUR million) 114 99 487 1,288 2,099
Profi t before tax (in EUR million)
Insurance profi t before tax 4,935 3,978 4,322 3,506 4,453
Banking profi t before tax 5,005 4,916 3,418 2,371 1,468
Total profi t before tax 9,940 8,894 7,740 5,877 5,921
Taxation 1,907 1,379 1,709 1,490 1,089
Third-party interests 341 305 276 344 332
Net profi t 7,692 7,210 5,755
4,043
4,500
Divestments/special items -58 976 796 -10 1,067
Underlying net profi t 7,750 6,234 4,959 4,053 3,433
Figures per ordinary share (in EUR)
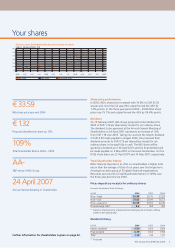
Net profi t 3.57 3.32 2.71 2.00 2.32
Distributable net profi t 3.57 3.32 2.71 2.00 2.20
Dividend 1.32 1.18 1.07 0.97 0.97
Shareholders’ equity (in parent) 17.78 16.96 12.95 10.08 9.14
Balance sheet (in EUR billion)
Total assets 1,226 1,159 964 779 716
Capital and reserves 38 37 28 21 18
Capital ratios
ING Group debt/equity ratio 9.0% 9.4% 10.2% 14.4% 19.9%
Insurance capital coverage ratio 274% 255% 204% 180% 169%
Insurance debt/equity ratio 14.2% 13.4% 14.3% 19.8% 22.8%
Bank Tier-1 ratio 7.63% 7.32% 6.92% 7.59% 7.31%
Market capitalisation (in EUR billion) 74 65 49 39 32
Key Performance Indicators
Return on equity 23.5% 26.6% 25.4% 21.5% 17.4%
Net profi t growth 7% 25% n.a. -10% -2%
Insurance
Value of new life business (in EUR million) 807 805 632 440 519
Internal rate of return (life) 13.3% 13.2% 12.1% 10.9% 11.5%
Combined ratio (non-life) 91% 95% 94% 98% 102%
Banking
Cost/income ratio (total) 64.0% 63.9% 69.4% 70.1% 74.1%
Risk-adjusted return on capital after tax (total) 19.7% 22.6% 14.5%
Assets under management (in EUR billion) 600 547 492 463 449
Employees (FTEs at year-end) 119,801 116,614 112,195 114,335 116, 20 0
(1) Figures according to Dutch GAAP.
(2) Including inter-company eliminations.
(3) Including other impairments.
Key fi gures
1 ING Group Annual Review 2006