ING Direct 2006 Annual Report Download - page 12
Download and view the complete annual report
Please find page 12 of the 2006 ING Direct annual report below. You can navigate through the pages in the report by either clicking on the pages listed below, or by using the keyword search tool below to find specific information within the annual report.-
 1
1 -
 2
2 -
 3
3 -
 4
4 -
 5
5 -
 6
6 -
 7
7 -
 8
8 -
 9
9 -
 10
10 -
 11
11 -
 12
12 -
 13
13 -
 14
14 -
 15
15 -
 16
16 -
 17
17 -
 18
18 -
 19
19 -
 20
20 -
 21
21 -
 22
22 -
23
-
24
-
25
-
26
-
27
-
28
-
29
-
30
-
31
-
32
-
33
-
34
-
35
-
36
 |
 |

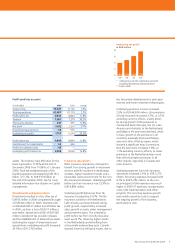
Contribution business lines to 2006 underlying profit before tax*
in percentages
Insurance Europe 23
Insurance Americas 20
Insurance Asia/Pacific 6
Wholesale Banking 25
Retail Banking 19
ING Direct 7
Total 100
* Excludes component ‘Other’ in Banking and Insurance.
Our performance
continued
Financial highlights continued
Embedded value and value of new
business
The embedded value of ING’s life
insurance businesses increased 7.7% to
EUR 29,714 million in 2006. Taking into
account EUR 1,996 million in net dividends
that were paid to ING Group, the year-end
embedded value was EUR 27,718 million.
Embedded value profi t, an important
measure of value creation, decreased
12.1% to EUR 1,981 million as improved
fi nancial performance was more than
offset by lower operational performance
variances and negative assumption
changes. The value of new business
increased slightly with 0.2% to EUR 807
million as it was negatively impacted by
an increase of the discount rate to refl ect
higher interest rates.
The insurance activities in Central and
Rest of Europe and in Asia/Pacifi c both
generated particularly strong growth
in 2006, indicating the strong future
earnings potential of the businesses in
both regions. New sales, measured in
annual premium equivalent, rose 2.9%
to EUR 6,495 million, while the internal
rate of return increased to 13.3% from
13.2% in 2005. The internal rate of
return in developing markets increased to
17.7% up from 17.4% as business units
benefi ted from increased scale. New sales
in developing markets rose 11.7%.
Banking operations
ING’s banking activities continued to
show strong growth in savings and
mortgages, which helped offset the
impact of fl attening yield curves. Operating
expenses were under control, while risk
costs remained very low, although the
fourth quarter of 2006 showed an increase
as releases from old provisions diminish.
Underlying profi t before tax rose 11.4%
to EUR 5,072 million, driven by a 7.3%
increase in income, notably from ING Real
Estate and ING Direct. Interest income rose
2.6% as strong volume growth was largely
offset by the impact of fl attening yield
curves. Loans and advances to customers
increased by EUR 34.7 billion, or 8.6%, to
EUR 437.8 billion, despite the divestments
of Deutsche Hypothekenbank and Degussa
Bank in 2006.
Growth was driven mainly by residential
mortgage lending at ING Direct and the
retail banking activities in the Netherlands.
The total interest margin narrowed to
1.06% from 1.17% in 2005. Commission
income rose 15.5%, driven by higher
management fees, mainly from the
investment management activities at ING
Real Estate, and increased fees from the
securities business, brokerage & advisory
and insurance broking. Investment income
was up 4.1%, while other income rose
26.8%, mainly caused by a strong increase
in net trading income.
Underlying operating expenses were
up 4.9% to EUR 9,032 million, including
EUR 164 million in additional compliance-
related costs in 2006. ING Direct
contributed 2.3%-points to the expense
growth of the bank activities. Although
the underlying addition to the provision
for loan losses increased to EUR 100
million from EUR 69 million in 2005,
risk costs were only three basis points
of average credit-risk-weighted assets,
which is well below the normalised level
of 25-30 basis points.
Asset management
Assets under management increased
9.6% to EUR 600 billion in 2006.
Compared with 2005, growth was
mainly offset by the negative impact
of exchange rates of EUR 31.8 billion,
while developments on stock markets
contributed EUR 33.7 billion to growth.
The net infl ow of EUR 43.8 billion was
mainly realised by Insurance Asia/Pacifi c
(EUR 11.2 billion), ING Real Estate
(EUR 13.5 billion) and Insurance Americas
(EUR 6.8 billion). Growth was achieved
for the greater part in third-party assets,
which increased by 14.7% to EUR 404.5
billion by year-end 2006. Proprietary
assets increased 0.4% to EUR 195.5 billion.
Looking ahead
Our strong profi t growth in 2006
demonstrates the solid earnings capacity
of ING’s well-balanced portfolio of
businesses. While the interest rate
environment in 2006 was challenging,
particularly for our banking business,
we have benefi ted from rallying equity
and real estate markets, a benign credit
environment, a favourable underwriting
cycle in non-life insurance and lower
taxes. Looking forward, risk costs and
non-life claims will trend gradually to more
normalised levels, however we do not
anticipate a signifi cant shift in the market
environment over the coming period.
ING Group Annual Review 2006
10