Huntington National Bank 2008 Annual Report Download - page 2
Download and view the complete annual report
Please find page 2 of the 2008 Huntington National Bank annual report below. You can navigate through the pages in the report by either clicking on the pages listed below, or by using the keyword search tool below to find specific information within the annual report.-
 1
1 -
 2
2 -
 3
3 -
 4
4 -
 5
5 -
 6
6 -
 7
7 -
 8
8 -
 9
9 -
 10
10 -
 11
11 -
 12
12 -
 13
13 -
14
-
15
-
16
-
17
-
18
-
19
-
20
-
21
-
22
-
23
-
24
-
25
-
26
-
27
-
28
-
29
-
30
-
31
-
32
-
33
-
34
-
35
-
36
-
37
-
38
-
39
-
40
-
41
-
42
-
43
-
44
-
45
-
46
-
47
-
48
-
49
-
50
-
51
-
52
-
53
-
54
-
55
-
56
-
57
-
58
-
59
-
60
-
61
-
62
-
63
-
64
-
65
-
66
-
67
-
68
-
69
-
70
-
71
-
72
-
73
-
74
-
75
-
76
-
77
-
78
-
79
-
80
-
81
-
82
-
83
-
84
-
85
-
86
-
87
-
88
-
89
-
90
-
91
-
92
-
93
-
94
-
95
-
96
-
97
-
98
-
99
-
100
-
101
-
102
-
103
-
104
-
105
-
106
-
107
-
108
-
109
-
110
-
111
-
112
-
113
-
114
-
115
-
116
-
117
-
118
-
119
-
120
-
121
-
122
-
123
-
124
-
125
-
126
-
127
-
128
-
129
-
130
-
131
-
132
 |
 |

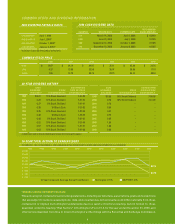
CONSOLIDATED FINANCIAL HIGHLIGHTS
Huntington Bancshares Incorporated (NASDAQ: HBAN) is a $54 billion regional bank holding company head-
quartered in Columbus, Ohio. Its principal markets are Ohio, Michigan, Pennsylvania, Indiana, West Virginia,
and Kentucky. Founded in 1866, Huntington serves its customers as the “local bank with national resources.”
Nearly 11,000 associates provide consumer and commercial banking, mortgage banking, automobile financing,
equipment leasing, investment management, brokerage, trust, and insurance services. Customers have
convenient access to banking services through more than 600 regional banking offices, the customer
service call center at (800) 480-BANK (2265), online at www.huntington.com, and through Huntington’s
network of almost 1,400 ATMs. Nonbanking financial services are provided through selected banking
offices, as well as other local facilities.
IN THOUSANDS, EXCEPT PER SHARE AMOUNTS 2008 2007 Change
NET (LOSS) INCOME $ (113,806) $ 75,169 N.M.
PER COMMON SHARE AMOUNTS
Net (loss) income per common share – diluted $ (0.44) $ 0.25 N.M.
Cash dividends declared per common share 0.6625 1.06 (37.5)%
Tangible book value per common share (1) 5.63 7.13 (21.0)
PERFORMANCE RATIOS
Return on average total assets (0.21) % 0.17 %
Return on average total shareholders’ equity (1.8) 1.6
Net interest margin (2) 3.25 3.36
Efficiency ratio (3) 57.0 62.5
Tangible equity/assets ratio (4) 7.72 5.08
CREDIT QUALITY MEASURES
Net charge-offs (NCOs) $ 758,067 $ 477,631 $ 280,436
NCOs as a % of average loans and leases 1.85 % 1.44 %
Nonaccrual loans (NALs) (1) $ 1,502,147 $ 319,771 $ 1,182,376
NALs as a % of total loans and leases (1) 3.66 % 0.80 %
Nonperforming assets (NPAs) and
accruing restructured loans (ARLs) (1) $ 1,943,063 $ 1,660,270 $ 282,793
Allowance for credit losses (ACL) (1) 944,366 644,970 299,396
ACL as a % of total loans and leases (1) 2.30 % 1.61 %
ACL as a % of NALs (1) 63 202
BALANCE SHEET – DECEMBER 31,
Total loans and leases $ 41,092,165 $ 40,054,338 2.6%
Total assets 54,352,859 54,697,468 (0.6)
Total deposits 37,943,286 37,742,921 0.5
Total shareholders’ equity 7,227,141 5,949,140 21.5
N.M., NOT A MEANINGFUL VALUE.
(1) AT DECEMBER 31.
(2) ON A FULLY-TAXABLE EQUIVALENT (FTE) BASIS ASSUMING A 35% TAX RATE.
(3) NONINTEREST EXPENSE LESS AMORTIZATION OF INTANGIBLES DIVIDED BY THE SUM OF FTE NET INTEREST INCOME AND
NONINTEREST INCOME EXCLUDING SECURITIES LOSSES.
(4) AT END OF PERIOD. TANGIBLE EQUITY (TOTAL EQUITY LESS GOODWILL AND OTHER INTANGIBLE ASSETS) DIVIDED BY TANGIBLE ASSETS
(TOTAL ASSETS LESS GOODWILL AND OTHER INTANGIBLE ASSETS). OTHER INTANGIBLE ASSETS ARE NET OF DEFERRED TAX.