Huntington National Bank 2008 Annual Report Download - page 14
Download and view the complete annual report
Please find page 14 of the 2008 Huntington National Bank annual report below. You can navigate through the pages in the report by either clicking on the pages listed below, or by using the keyword search tool below to find specific information within the annual report.-
 1
1 -
2
-
3
-
 4
4 -
 5
5 -
 6
6 -
 7
7 -
 8
8 -
 9
9 -
 10
10 -
 11
11 -
 12
12 -
 13
13 -
 14
14 -
 15
15 -
 16
16 -
 17
17 -
 18
18 -
 19
19 -
 20
20 -
 21
21 -
 22
22 -
 23
23 -
 24
24 -
25
-
26
-
27
-
28
-
29
-
30
-
31
-
32
-
33
-
34
-
35
-
36
-
37
-
38
-
39
-
40
-
41
-
42
-
43
-
44
-
45
-
46
-
47
-
48
-
49
-
50
-
51
-
52
-
53
-
54
-
55
-
56
-
57
-
58
-
59
-
60
-
61
-
62
-
63
-
64
-
65
-
66
-
67
-
68
-
69
-
70
-
71
-
72
-
73
-
74
-
75
-
76
-
77
-
78
-
79
-
80
-
81
-
82
-
83
-
84
-
85
-
86
-
87
-
88
-
89
-
90
-
91
-
92
-
93
-
94
-
95
-
96
-
97
-
98
-
99
-
100
-
101
-
102
-
103
-
104
-
105
-
106
-
107
-
108
-
109
-
110
-
111
-
112
-
113
-
114
-
115
-
116
-
117
-
118
-
119
-
120
-
121
-
122
-
123
-
124
-
125
-
126
-
127
-
128
-
129
-
130
-
131
-
132
 |
 |

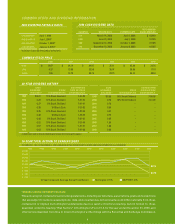
Selected Financial Data Huntington Bancshares Incorporated
Table 1 — Selected Financial Data
(1)
(in thousands, except per share amounts) 2008 2007 2006 2005 2004
Year Ended December 31,
Interest income $ 2,798,322 $ 2,742,963 $ 2,070,519 $ 1,641,765 $ 1,347,315
Interest expense 1,266,631 1,441,451 1,051,342 679,354 435,941
Net interest income 1,531,691 1,301,512 1,019,177 962,411 911,374
Provision for credit losses 1,057,463 643,628 65,191 81,299 55,062
Net interest income after provision for credit losses 474,228 657,884 953,986 881,112 856,312
Service charges on deposit accounts 308,053 254,193 185,713 167,834 171,115
Automobile operating lease income 39,851 7,810 43,115 133,015 285,431
Securities (losses) gains (197,370) (29,738) (73,191) (8,055) 15,763
Other non-interest income 556,604 444,338 405,432 339,488 346,289
Total noninterest income 707,138 676,603 561,069 632,282 818,598
Personnel costs 783,546 686,828 541,228 481,658 485,806
Automobile operating lease expense 31,282 5,161 31,286 103,850 235,080
Other non-interest expense 662,546 619,855 428,480 384,312 401,358
Total noninterest expense 1,477,374 1,311,844 1,000,994 969,820 1,122,244
(Loss) Income before income taxes (296,008) 22,643 514,061 543,574 552,666
(Benefit) provision for income taxes (182,202) (52,526) 52,840 131,483 153,741
Net (loss) income $ (113,806) $ 75,169 $ 461,221 $ 412,091 $ 398,925
Dividends on preferred shares 46,400 ————
Net (loss) income applicable to common shares $ (160,206) $ 75,169 $ 461,221 $ 412,091 $ 398,925
Net (loss) income per common share — basic $(0.44) $0.25 $1.95 $1.79 $1.74
Net (loss) income per common share — diluted (0.44) 0.25 1.92 1.77 1.71
Cash dividends declared per common share 0.6625 1.060 1.000 0.845 0.750
Balance sheet highlights
Total assets (period end) $54,352,859 $54,697,468 $35,329,019 $32,764,805 $32,565,497
Total long-term debt (period end)
(2)
6,870,705 6,954,909 4,512,618 4,597,437 6,326,885
Total shareholders’ equity (period end) 7,227,141 5,949,140 3,014,326 2,557,501 2,537,638
Average long-term debt
(2)
7,374,681 5,714,572 4,942,671 5,168,959 6,650,367
Average shareholders’ equity 6,393,788 4,631,912 2,945,597 2,582,721 2,374,137
Average total assets 54,921,419 44,711,676 35,111,236 32,639,011 31,432,746
Key ratios and statistics
Margin analysis — as a % of average earnings assets
Interest income
(3)
5.90%7.02% 6.63% 5.65% 4.89%
Interest expense 2.65 3.66 3.34 2.32 1.56
Net interest margin
(3)
3.25% 3.36% 3.29% 3.33% 3.33%
Return on average total assets (0.21)% 0.17% 1.31% 1.26% 1.27%
Return on average total shareholders’ equity (1.8) 1.6 15.7 16.0 16.8
Return on average tangible shareholders’ equity
(4)
(2.1) 3.9 19.5 17.4 18.5
Efficiency ratio
(5)
57.0 62.5 59.4 60.0 65.0
Dividend payout ratio N.M. N.M. 52.1 47.7 43.9
Average shareholders’ equity to average assets 11.64 10.36 8.39 7.91 7.55
Effective tax rate N.M. N.M. 10.3 24.2 27.8
Tangible common equity to tangible assets (period end)
(6)
4.04 5.08 6.93 7.19 7.18
Tangible equity to tangible assets (period end)
(7)
7.72 5.08 6.93 7.19 7.18
Tier 1 leverage ratio (period end) 9.82 6.77 8.00 8.34 8.42
Tier 1 risk-based capital ratio (period end) 10.72 7.51 8.93 9.13 9.08
Total risk-based capital ratio (period end) 13.91 10.85 12.79 12.42 12.48
Other data
Full-time equivalent employees (period end) 10,951 11,925 8,081 7,602 7,812
Domestic banking offices (period end) 613 625 381 344 342
N.M., not a meaningful value.
(1) Comparisons for presented periods are impacted by a number of factors. Refer to the “Significant Items” for additional discussion regarding these key factors.
(2) Includes Federal Home Loan Bank advances, subordinated notes, and other long-term debt.
(3) On a fully taxable equivalent (FTE) basis assuming a 35% tax rate.
(4) Net (loss) income less expense excluding amortization of intangibles for the period divided by average tangible shareholders’ equity. Average tangible shareholders’ equity equals average total shareholders’
equity less average intangible assets and goodwill. Expense for amortization of intangibles and average intangible assets are net of deferred tax liability, and calculated assuming a 35% tax rate.
(5) Noninterest expense less amortization of intangibles divided by the sum of FTE net interest income and noninterest income excluding securities gains.
(6) Tangible common equity (total common equity less goodwill and other intangible assets) divided by tangible assets (total assets less goodwill and other intangible assets). Other intangible assets are net of
deferred tax, and calculated assuming a 35% tax rate.
(7) Tangible equity (total equity less goodwill and other intangible assets) divided by tangible assets (total assets less goodwill and other intangible assets). Other intangible assets are net of deferred tax, and
calculated assuming a 35% tax rate.
12