Hormel Foods 2011 Annual Report Download - page 2
Download and view the complete annual report
Please find page 2 of the 2011 Hormel Foods annual report below. You can navigate through the pages in the report by either clicking on the pages listed below, or by using the keyword search tool below to find specific information within the annual report.-
 1
1 -
 2
2 -
 3
3 -
 4
4 -
 5
5 -
 6
6 -
 7
7 -
 8
8 -
 9
9 -
 10
10 -
 11
11 -
 12
12 -
 13
13 -
14
-
15
-
16
-
17
-
18
-
19
-
20
-
21
-
22
-
23
-
24
-
25
-
26
-
27
-
28
-
29
-
30
-
31
-
32
-
33
-
34
-
35
-
36
-
37
-
38
-
39
-
40
-
41
-
42
-
43
-
44
-
45
-
46
-
47
-
48
-
49
-
50
-
51
-
52
-
53
-
54
-
55
-
56
-
57
-
58
-
59
-
60
-
61
-
62
-
63
-
64
-
65
-
66
 |
 |

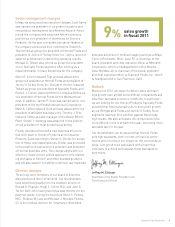
(in thousands, except per share amounts) 2011 2010 Change % change
Net Sales $7,895,089 $7,220,719 $674,370 9.3%
Net Earnings Attributable to Hormel Foods 474,195 395,587 78,608 19.9
Percent of Sales 6.0% 5.5%
Earnings Per Share*
Basic $ 1.78 $ 1.48 $ 0.30 20.3
Diluted 1.74 1.46 0.28 19.2
Dividends Declared to Shareholders 136,035 111,830 24,205 21.6
Per Share of Common Stock* 0.51 0.42 0.09 21.4
Average Common Shares Outstanding*
Basic 266,394 266,732 (338) (0.1)
Diluted 271,915 270,698 1,217 0.4
Capital Additions $ 96,911 $ 89,823 $ 7,088 7.9
Depreciation and Amortization 124,165 125,591 (1,426) (1.1)
Working Capital 1,220,045 756,953 463,092 61.2
Hormel Foods Corporation
Shareholders’ Investment 2,656,582 2,400,657 255,925 10.7
FINANCIAL HIGHLIGHTS
NET SALES
Dollars in billions
Compound annual growth
rate (CAGR ) 6.3%
DILUTED EARNINGS*
Dollars per share
CAGR 12.7%
SEGMENT
OPERATING PROFIT
Dollars in millions
CAGR 11.1%
ANNUAL DIVIDENDS*
Dollars per share
CAGR 14.2%
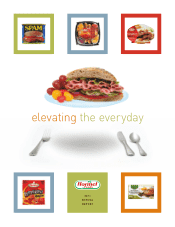
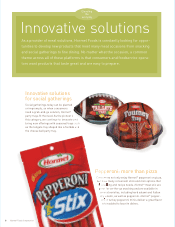
Table of contents 2 Letter to shareholders 4 At-a-glance 6 Elevating the everyday 12 Financial section
60 Shareholder information 62 Corporate offi cers 63 Board of directors
SEGMENT SALES 2011
■ Refrigerated Foods 53%
■ Jennie-O Turkey Store 19%
■ Grocery Products 13%
■ Specialty Foods 11%
■ All other (International) 4%
SEGMENT OPERATING
PROFIT 2011
■ Refrigerated Foods 38%
■ Jennie-O Turkey Store 26%
■ Grocery Products 21%
■ Specialty Foods 10%
■ All other (International) 5%
1110090807
$7.9
$7.2
$6.5
$6.8
$6.2
1110090807
$1.74
$1.46
$1.27
$1.04
$1.08
1110090807
$773
$683
$572
$536
$507
1110090807
$0.51
$0.42
$0.38
$0.37
$0.30
* Shares and per share fi gures have been restated, as appropriate, to refl ect the two-for-one stock split effected February 1, 2011.
See Notes to Consolidated Financial Statements.