Home Shopping Network 2013 Annual Report Download - page 19
Download and view the complete annual report
Please find page 19 of the 2013 Home Shopping Network annual report below. You can navigate through the pages in the report by either clicking on the pages listed below, or by using the keyword search tool below to find specific information within the annual report.-
 1
1 -
2
-
3
-
4
-
5
-
6
-
7
-
8
-
 9
9 -
 10
10 -
 11
11 -
 12
12 -
 13
13 -
 14
14 -
 15
15 -
 16
16 -
 17
17 -
 18
18 -
 19
19 -
 20
20 -
 21
21 -
 22
22 -
 23
23 -
 24
24 -
 25
25 -
 26
26 -
 27
27 -
 28
28 -
 29
29 -
30
-
31
-
32
-
33
-
34
-
35
-
36
-
37
-
38
-
39
-
40
-
41
-
42
-
43
-
44
-
45
-
46
-
47
-
48
-
49
-
50
-
51
-
52
-
53
-
54
-
55
-
56
-
57
-
58
-
59
-
60
-
61
-
62
-
63
-
64
-
65
-
66
-
67
-
68
-
69
-
70
-
71
-
72
-
73
-
74
-
75
-
76
-
77
-
78
-
79
-
80
-
81
-
82
-
83
-
84
 |
 |

17
During the quarter ended December 31, 2013, we repurchased approximately 0.2 million shares at an average price of
$51.99 per share. Below is a summary of our common stock repurchases during the fourth quarter of 2013, as well as the
number of shares still available for purchase as of December 31, 2013:
Period
Number of
Shares Purchased
Average Price
Paid Per Share
Number of
Shares Purchased
as Part of Publicly
Announced Plans
or Programs
Maximum Number
of Shares that May
Yet Be Purchased
under the Plans or
Programs
October 1, 2013 - October 31, 2013 . . . . . . . . . . . . . . . . . 168,313 $ 51.96 168,313 1,032,446
November 1, 2013 - November 30, 2013 . . . . . . . . . . . . . 21,500 $ 52.29 21,500 1,010,946
December 1, 2013 - December 31, 2013 . . . . . . . . . . . . . — $ — — 1,010,946
189,813 189,813
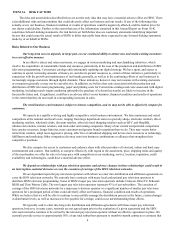
Performance Graph
The graph depicted below compares the five-year performance of our common stock with the cumulative total return on
the S&P 500 Retailing Index and the Russell 2000 Index from December 31, 2008 through December 31, 2013.
*Assumes $100 invested on 12/31/08, including reinvestment of dividends.
12/31/2008 12/31/2009 12/31/2010 12/31/2011 12/31/2012 12/31/2013
HSN, Inc. . . . . . . . . . . . . . . . . . . . . . . 100.00 277.72 421.60 500.51 770.13 883.59
S&P 500 Retailing Index . . . . . . . . . . 100.00 154.37 197.92 211.12 270.86 397.30
Russell 2000 Index . . . . . . . . . . . . . . . 100.00 127.17 161.32 154.59 179.86 249.69
$600
$700
$800
$900
$1,000
COMPARISON OF 5 YEAR CUMULATIVE TOTAL RETURN*
Among HSN, Inc., the S&P 500 retailing Index, and the Russell 2000 Index
$0
$100
$200
$300
$400
$500
$600
$700
$800
$900
$1,000
12/08 12/09 12/10 12/11 12/12 12/13
COMPARISON OF 5 YEAR CUMULATIVE TOTAL RETURN*
Among HSN, Inc., the S&P 500 retailing Index, and the Russell 2000 Index
HSN, Inc. S&P 500 Retailing Index Russell 2000