Home Shopping Network 2008 Annual Report Download - page 21
Download and view the complete annual report
Please find page 21 of the 2008 Home Shopping Network annual report below. You can navigate through the pages in the report by either clicking on the pages listed below, or by using the keyword search tool below to find specific information within the annual report.-
 1
1 -
2
-
3
-
4
-
5
-
6
-
7
-
8
-
9
-
10
-
 11
11 -
 12
12 -
 13
13 -
 14
14 -
 15
15 -
 16
16 -
 17
17 -
 18
18 -
 19
19 -
 20
20 -
 21
21 -
 22
22 -
 23
23 -
 24
24 -
 25
25 -
 26
26 -
 27
27 -
 28
28 -
 29
29 -
 30
30 -
 31
31 -
32
-
33
-
34
-
35
-
36
-
37
-
38
-
39
-
40
-
41
-
42
-
43
-
44
-
45
-
46
-
47
-
48
-
49
-
50
-
51
-
52
-
53
-
54
-
55
-
56
-
57
-
58
-
59
-
60
-
61
-
62
-
63
-
64
-
65
-
66
-
67
-
68
-
69
-
70
-
71
-
72
-
73
-
74
-
75
-
76
-
77
-
78
-
79
-
80
-
81
-
82
-
83
-
84
-
85
-
86
-
87
-
88
-
89
-
90
-
91
 |
 |

18
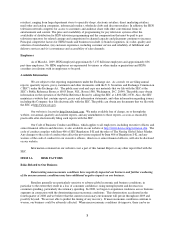
Performance Graph
The graph depicted below compares the performance of our common stock with the cumulative total return
on the S&P 500 Retailing Index and the Russell 2000 Index from August 12, 2008, the first day of trading of the
Company’s common stock after the spin-off through December 31, 2008, the last day of our fiscal year.
COMPARISON CUMULATIVE TOTAL RETURN
AMONG HSN, INC.,
RUSSELL 2000 INDEX AND S&P RETAILING INDEX
0
25
50
75
100
125
150
39672 39691 39721 39752 39782 39813
DOLLARS
HSN, INC. S&P RETAILING INDEX RUSSELL 2000 INDEX
ASSUMES $100 INVESTED ON AUGUST 12, 2008
ASSUMES DIVIDEND REINVESTED
FISCAL YEAR ENDED DECEMBER 31, 2008
8/12/2008 8/29/2008 9/30/2008 10/31/2008 11/28/2008 12/31/2008
HSN, Inc. 100.00 134.40 101.01 56.42 34.31 66.70
S&P 500 Retailing Index 100.00 112.75 103.36 85.85 75.13 80.07
Russell 2000 Index 100.00 99.36 91.44 72.42 63.85 67.56
Issuer Purchases of Equity Security
No purchases of our equity securities were made by or on behalf of us in fiscal 2008.