Hess 2014 Annual Report Download - page 3
Download and view the complete annual report
Please find page 3 of the 2014 Hess annual report below. You can navigate through the pages in the report by either clicking on the pages listed below, or by using the keyword search tool below to find specific information within the annual report.-
 1
1 -
 2
2 -
 3
3 -
 4
4 -
 5
5 -
 6
6 -
 7
7 -
 8
8 -
 9
9 -
 10
10 -
 11
11 -
 12
12 -
 13
13 -
 14
14 -
15
-
16
-
17
-
18
-
19
-
20
-
21
-
22
-
23
-
24
-
25
-
26
-
27
-
28
-
29
-
30
-
31
-
32
-
33
-
34
-
35
-
36
-
37
-
38
-
39
-
40
-
41
-
42
-
43
-
44
-
45
-
46
-
47
-
48
-
49
-
50
-
51
-
52
-
53
-
54
-
55
-
56
-
57
-
58
-
59
-
60
-
61
-
62
-
63
-
64
-
65
-
66
-
67
-
68
-
69
-
70
-
71
-
72
-
73
-
74
-
75
-
76
-
77
-
78
-
79
-
80
-
81
-
82
-
83
-
84
-
85
-
86
-
87
-
88
-
89
-
90
-
91
-
92
-
93
-
94
-
95
-
96
-
97
-
98
-
99
-
100
-
101
-
102
-
103
-
104
-
105
-
106
-
107
-
108
-
109
-
110
-
111
-
112
-
113
-
114
-
115
-
116
-
117
-
118
-
119
-
120
-
121
-
122
-
123
-
124
-
125
-
126
-
127
-
128
-
129
-
130
-
131
-
132
-
133
-
134
-
135
-
136
-
137
 |
 |

1
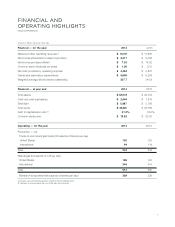
Financial — for the year 2014 2013
Sales and other operating revenues (a) $ 10,737 $ 11,905
Net income attributable to Hess Corporation $ 2,317 $ 5,052
Net income per share diluted $ 7.53 $ 14.82
Common stock dividends per share $ 1.00 $ 0.70
Net cash provided by operating activities $ 4,464 $ 4,870
Capital and exploratory expenditures $ 5,606 $ 6,209
Weighted average diluted shares outstanding 307.7 340.9
Financial — at year end 2014 2013
Total assets $ 38,578 $ 42,754
Cash and cash equivalents $ 2,444 $ 1,814
Total debt $ 5,987 $ 5,798
Total equity $ 22,320 $ 24,784
Debt to capitalization ratio (b) 21.2 % 19.0 %
Common stock price $ 73.82 $ 83.00
Operating — for the year 2014 2013
Production — net
Crude oil and natural gas liquids (thousands of barrels per day)
United States 150 123
International
94 119
Total 244 242
Natural gas (thousands of mcf per day)
United States 165 124
International
348 441
Total 513 565
Barrels of oil equivalent (thousands of barrels per day)
329 336
HESS CORPORATION
Amounts in millions, except per share data
(a) Excludes sales and operating revenues related to discontinued operations.
(b) Total debt as a percentage of the sum of total debt and total equity.
FINANCIAL AND
OPERATING HIGHLIGHTS