Hertz 2013 Annual Report Download - page 44
Download and view the complete annual report
Please find page 44 of the 2013 Hertz annual report below. You can navigate through the pages in the report by either clicking on the pages listed below, or by using the keyword search tool below to find specific information within the annual report.-
 1
1 -
2
-
3
-
4
-
5
-
6
-
7
-
8
-
9
-
10
-
11
-
12
-
13
-
14
-
15
-
16
-
17
-
18
-
19
-
20
-
21
-
22
-
23
-
24
-
25
-
26
-
27
-
28
-
29
-
30
-
31
-
32
-
33
-
 34
34 -
 35
35 -
 36
36 -
 37
37 -
 38
38 -
 39
39 -
 40
40 -
 41
41 -
 42
42 -
 43
43 -
 44
44 -
 45
45 -
 46
46 -
 47
47 -
 48
48 -
 49
49 -
 50
50 -
 51
51 -
 52
52 -
 53
53 -
 54
54 -
55
-
56
-
57
-
58
-
59
-
60
-
61
-
62
-
63
-
64
-
65
-
66
-
67
-
68
-
69
-
70
-
71
-
72
-
73
-
74
-
75
-
76
-
77
-
78
-
79
-
80
-
81
-
82
-
83
-
84
-
85
-
86
-
87
-
88
-
89
-
90
-
91
-
92
-
93
-
94
-
95
-
96
-
97
-
98
-
99
-
100
-
101
-
102
-
103
-
104
-
105
-
106
-
107
-
108
-
109
-
110
-
111
-
112
-
113
-
114
-
115
-
116
-
117
-
118
-
119
-
120
-
121
-
122
-
123
-
124
-
125
-
126
-
127
-
128
-
129
-
130
-
131
-
132
-
133
-
134
-
135
-
136
-
137
-
138
-
139
-
140
-
141
-
142
-
143
-
144
-
145
-
146
-
147
-
148
-
149
-
150
-
151
-
152
-
153
-
154
-
155
-
156
-
157
-
158
-
159
-
160
-
161
-
162
-
163
-
164
-
165
-
166
-
167
-
168
-
169
-
170
-
171
-
172
-
173
-
174
-
175
-
176
-
177
-
178
-
179
-
180
-
181
-
182
-
183
-
184
-
185
-
186
-
187
-
188
-
189
-
190
-
191
 |
 |

Table of Contents
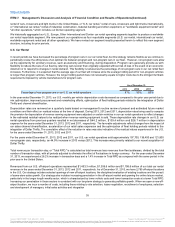
We selected the Dow Jones Specialized Consumer Services sub-sector within the consumer services industry, and we used the U.S. large
capitalization component, which includes the top 70% of the index universe (by market value).
The calculation of the historical volatility of the index was made using the daily historical closing values of the index for the preceding 6.25
years, because that is the expected term of the options using the simplified approach.
Beginning in 2012, we have determined that there is now sufficient historical information available to estimate the expected volatility of our
stock price. Therefore for equity awards made in 2012 the assumed volatility for our stock price is based on a weighted average combining
implied volatility and the average of our peer’s most recent 5.79-year volatility and mean reversion volatility. The assumed dividend yield is
zero. The risk-free interest rate is the implied zero-coupon yield for U.S. Treasury securities having a maturity approximately equal to the
expected term of the options, as of the grant dates. The non-cash stock-based compensation expense associated with the Hertz Global
Holdings, Inc. Stock Incentive Plan, or the “Stock Incentive Plan,” the Hertz Global Holdings, Inc. Director Stock Incentive Plan, or the
“Director Plan,” and the Hertz Global Holdings, Inc. 2008 Omnibus Incentive Plan, or the “Omnibus Plan,” are pushed down from Hertz
Holdings and recorded on the books at the Hertz level. See Note 7 to the Notes to our audited annual consolidated financial statements
included in this Annual Report under the caption “Item 8—Financial Statements and Supplementary Data.”
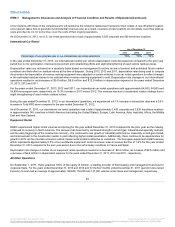
Recent Accounting Pronouncements
For a discussion of recent accounting pronouncements, see Note 2 to the Notes to our audited annual consolidated financial statements
included in this Annual Report under the caption “Item 8—Financial Statements and Supplementary Data.”
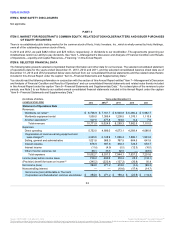
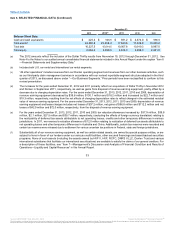
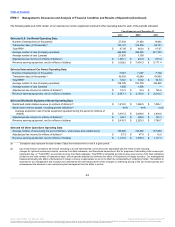
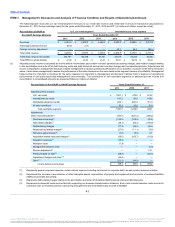
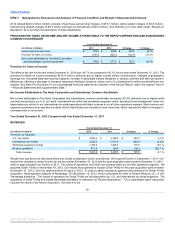
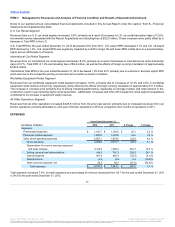
In the following discussion, comparisons are made between the years ended December 31, 2013, 2012 and 2011. The following table sets
forth for each of the periods indicated, the percentage of total revenues represented by the various line items in our consolidated statements of
operations (in millions of dollars):
Revenues:
Worldwide car rental $ 8,706.9
$7,161.7
$6,940.8
80.8 %
79.4 %
83.6 %
Worldwide equipment rental 1,538.0
1,385.4
1,209.5
14.3
15.4
14.6
All other operations 527.0
477.8
149.0
4.9
5.2
1.8
Total revenues 10,771.9
9,024.9
8,299.3
100.0
100.0
100.0
Expenses:
Direct operating 5,752.0
4,806.0
4,573.1
53.4
53.3
55.1
Depreciation of revenue earning
equipment and lease charges 2,525.5
2,128.9
1,896.2
23.4
23.6
22.8
Selling, general and administrative 1,021.8
968.0
767.5
9.5
10.7
9.3
Interest expense 678.9
597.8
650.3
6.3
6.6
7.8
Interest income (11.6)
(4.9)
(5.5)
(0.1)
(0.1)
(0.1)
Other (income) expense, net 66.1
35.5
62.5
0.7
0.4
0.8
Total expenses 10,032.7
8,531.3
7,944.1
93.2
94.5
95.7
Income before income taxes 739.2
493.6
355.2
6.8
5.5
4.3
Provision for taxes on income (345.2)
(222.4)
(137.2)
(3.1)
(2.5)
(1.7)
Net income 394.0
271.2
218.0
3.7
3.0
2.6
Less: Net income attributable to
noncontrolling interest —
—
(19.6)
—
—
(0.3)
Net income attributable to The Hertz
Corporation and Subsidiaries' common
stockholder $394.0
$271.2
$198.4
3.7 %
3.0 %
2.3 %
41
Source: HERTZ CORP, 10-K, March 31, 2014 Powered by Morningstar® Document Research℠
The information contained herein may not be copied, adapted or distributed and is not warranted to be accurate, complete or timely. The user assumes all risks for any damages or losses arising from any use of this information,
except to the extent such damages or losses cannot be limited or excluded by applicable law. Past financial performance is no guarantee of future results.