Hertz 2012 Annual Report Download - page 3
Download and view the complete annual report
Please find page 3 of the 2012 Hertz annual report below. You can navigate through the pages in the report by either clicking on the pages listed below, or by using the keyword search tool below to find specific information within the annual report.-
 1
1 -
 2
2 -
 3
3 -
 4
4 -
 5
5 -
 6
6 -
 7
7 -
 8
8 -
 9
9 -
 10
10 -
 11
11 -
 12
12 -
 13
13 -
 14
14 -
15
-
16
-
17
-
18
-
19
-
20
-
21
-
22
-
23
-
24
-
25
-
26
-
27
-
28
-
29
-
30
-
31
-
32
-
33
-
34
-
35
-
36
-
37
-
38
-
39
-
40
-
41
-
42
-
43
-
44
-
45
-
46
-
47
-
48
-
49
-
50
-
51
-
52
-
53
-
54
-
55
-
56
-
57
-
58
-
59
-
60
-
61
-
62
-
63
-
64
-
65
-
66
-
67
-
68
-
69
-
70
-
71
-
72
-
73
-
74
-
75
-
76
-
77
-
78
-
79
-
80
-
81
-
82
-
83
-
84
-
85
-
86
-
87
-
88
-
89
-
90
-
91
-
92
-
93
-
94
-
95
-
96
-
97
-
98
-
99
-
100
-
101
-
102
-
103
-
104
-
105
-
106
-
107
-
108
-
109
-
110
-
111
-
112
-
113
-
114
-
115
-
116
-
117
-
118
-
119
-
120
-
121
-
122
-
123
-
124
-
125
-
126
-
127
-
128
-
129
-
130
-
131
-
132
-
133
-
134
-
135
-
136
-
137
-
138
-
139
-
140
-
141
-
142
-
143
-
144
-
145
-
146
-
147
-
148
-
149
-
150
-
151
-
152
-
153
-
154
-
155
-
156
-
157
-
158
-
159
-
160
-
161
-
162
-
163
-
164
-
165
-
166
-
167
-
168
-
169
-
170
-
171
-
172
-
173
-
174
-
175
-
176
-
177
-
178
-
179
-
180
-
181
-
182
-
183
-
184
-
185
-
186
-
187
-
188
-
189
-
190
-
191
-
192
-
193
-
194
-
195
-
196
-
197
-
198
-
199
-
200
-
201
-
202
-
203
-
204
-
205
-
206
-
207
-
208
-
209
-
210
-
211
-
212
-
213
-
214
-
215
-
216
-
217
-
218
-
219
-
220
-
221
-
222
-
223
-
224
-
225
-
226
-
227
-
228
-
229
-
230
-
231
-
232
-
233
-
234
-
235
-
236
-
237
-
238
 |
 |

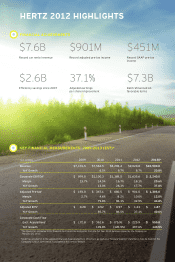
Record car rental revenue
$7.6 B
Record adjusted pre-tax income
$901M
Record GAAP pre-tax
income
$451M
Efficiency savings since 2007
$2.6B
Adjusted earnings
per share improvement
37.1%
Debt refinanced on
favorable terms
$7.3B
HERTZ 2012 HIGHLIGHTS
FINANCIAL ACHIEVEMENTS
($ in millions)
2009 2010 2011 2012 2013E*
Revenue $ 7,101.5 $ 7,562.5 $ 8,298.4 $ 9,020.8 $ 10,900.0
YoY Growth 6.5% 9.7% 8.7% 20.8%
Corporate EBITDA†$ 974.0 $ 1,100.3 $ 1,389.5 $ 1,635.6 $ 2,240.0
Margin 13.7% 14.5% 16.7% 18.1% 20.6%
YoY Growth 13.0% 26.3% 17.7% 37.0%
Adjusted Pre-tax†$ 193.0 $ 347.1 $ 680.5 $ 901.5 $ 1,305.0
Margin 2.7% 4.6% 8.2% 10.0% 12.0%
YoY Growth 79.8% 96.1% 32.5% 44.8%
Adjusted EPS†$ 0.28 $ 0.52 $ 0.97 $ 1.33 $ 1.87
YoY Growth 85.7% 86.5% 37.1% 40.6%
Corporate Cash Flow
Excl. Acquisitions†$ 172.8 $ 362.6 $ (75.9) $ 225.9 $ 550.0
YoY Growth 109.8% (120.9%) 397.6% 143.5%
*Theguresforestimated2013nancialmetricsarethemid-pointsfromtheFullYear2013GuidanceissuedbytheCompanyon
February25,2013.
†GAAPreconciliationtotheadjustednancialmeasurementsinthischart,aswellasa“forward-looking”statement,maybefoundinthe
Company’s201210-KwhichisincludedinthisAnnualReport.
KEY FINANCIAL MEASUREMENTS: 2009–2013 (EST)*