Health Net 2000 Annual Report Download - page 5
Download and view the complete annual report
Please find page 5 of the 2000 Health Net annual report below. You can navigate through the pages in the report by either clicking on the pages listed below, or by using the keyword search tool below to find specific information within the annual report.-
 1
1 -
 2
2 -
 3
3 -
 4
4 -
 5
5 -
 6
6 -
 7
7 -
 8
8 -
 9
9 -
 10
10 -
 11
11 -
 12
12 -
 13
13 -
 14
14 -
 15
15 -
 16
16 -
17
-
18
-
19
-
20
-
21
-
22
-
23
-
24
-
25
-
26
-
27
-
28
-
29
-
30
-
31
-
32
-
33
-
34
-
35
-
36
-
37
-
38
-
39
-
40
-
41
-
42
-
43
-
44
-
45
-
46
-
47
-
48
-
49
-
50
-
51
-
52
-
53
-
54
-
55
-
56
-
57
-
58
-
59
-
60
-
61
-
62
 |
 |

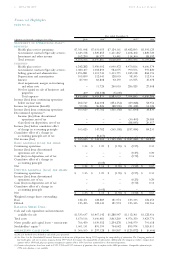
0
0
0
1997 1998 1999 2000
$(125,872) $100,867 $297,128 $366,163
Net Income (Loss)
(in thousands)
Operating Cash Flow
(in thousands)
Debt-to-Total Capital Ratio
Selling, General and Administrative
(including depreciation) Ratio
1997 1998 1999 2000
59.4% 62.8% 53.8% 41.9%
1997 1998 1999 2000
18.0% 17.5% 16.0% 15.2%
1997 1998 1999 2000
$(187,084) $(165,158) $142,365 $163,623
0
2000 Annual Report HEALTH NET 3