Health Net 1999 Annual Report Download - page 3
Download and view the complete annual report
Please find page 3 of the 1999 Health Net annual report below. You can navigate through the pages in the report by either clicking on the pages listed below, or by using the keyword search tool below to find specific information within the annual report.-
 1
1 -
 2
2 -
 3
3 -
 4
4 -
 5
5 -
 6
6 -
 7
7 -
 8
8 -
 9
9 -
 10
10 -
 11
11 -
 12
12 -
 13
13 -
 14
14 -
15
-
16
-
17
-
18
-
19
-
20
-
21
-
22
-
23
-
24
-
25
-
26
-
27
-
28
-
29
-
30
-
31
-
32
-
33
-
34
-
35
-
36
-
37
-
38
-
39
-
40
-
41
-
42
-
43
-
44
-
45
-
46
-
47
-
48
-
49
-
50
-
51
-
52
-
53
-
54
-
55
-
56
 |
 |

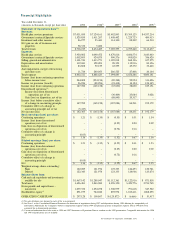
FOUNDATION HEALTH SYSTEMS, INC. 1
Year ended December 31,
(Amounts in thousands, except per share data) 1999 1998(3) 1997(3) 1996(3) 1995(3)
Statement of Operations Data(2):
Revenues
Health plan services premiums $ 7,031,055 $ 7,124,161 $ 5,482,893 $ 5,395,125 $ 4,557,214
Government contracts/ Specialty services 1,529,855 1,411,267 1,408,402 1,225,723 489,913
Investment and other income 86,977 93,441 114,300 88,392 66,510
Net gain on sale of businesses and
properties 58,332 5,600–––
Total revenues 8,706,219 8,634,469 7,005,595 6,709,240 5,113,637
Expenses
Health plan services 5,950,002 6,090,472 4,470,816 4,606,574 3,643,463
Government contracts/ Specialty services 1,002,893 924,075 990,576 995,820 356,420
Selling, general and administrative 1,301,743 1,413,771 1,185,018 868,196 657,275
Depreciation and amortization 112,041 128,093 98,353 112,916 89,356
Interest 83,808 92,159 63,555 45,372 33,463
Asset impairment, merger, restructuring
and other costs 11,724 240,053 286,525 27,408 20,164
Total expenses 8,462,211 8,888,623 7,094,843 6,656,286 4,800,141
Income (loss) from continuing operations
before income taxes 244,008 (254,154) (89,248) 52,954 313,496
Income tax provision (benefit) 96,226 (88,996) (21,418) 14,124 124,345
Income (loss) from continuing operations 147,782 (165,158) (67,830) 38,830 189,151
Discontinued operations(2):
Income (loss) from discontinued
operations, net of tax – – (30,409) 25,084 3,028
Gain (loss) on disposition, net of tax – – (88,845) 20,317 –
Income (loss) before cumulative effect
of a change in accounting principle 147,782 (165,158) (187,084) 84,231 192,179
Cumulative effect of a change in
accounting principle, net of tax (5,417) ––––
Net income (loss) $ 142,365 $ (165,158) $ (187,084) $ 84,231 $ 192,179
Basic earnings (loss) per share:
Continuing operations $ 1.21 $ (1.35) $ (0.55) $ 0.31 $ 1.54
Income (loss) from discontinued
operations, net of tax – – (0.25) 0.20 0.02
Gain (loss) on disposition of discontinued
operations, net of tax – – (0.72) 0.16 –
Cumulative effect of a change in
accounting principle (0.05) ––––
Net $ 1.16 $ (1.35) $ (1.52) $ 0.67 $ 1.56
Diluted earnings (loss) per share:
Continuing operations $ 1.21 $ (1.35) $ (0.55) $ 0.31 $ 1.53
Income (loss) from discontinued
operations, net of tax – – (0.25) 0.20 0.02
Gain (loss) on disposition of discontinued
operations, net of tax – – (0.72) 0.16 –
Cumulative effect of a change in
accounting principle (0.05) ––––
Net $ 1.16 $ (1.35) $ (1.52) $ 0.67 $ 1.55
Weighted average shares outstanding:
Basic 122,289 121,974 123,333 124,453 122,741
Diluted 122,343 121,974 123,333 124,966 123,674
Balance Sheet Data:
Cash and cash equivalents and investments
available for sale $ 1,467,142 $ 1,288,947 $ 1,112,361 $ 1,122,916 $ 871,818
Total assets 3,696,481 3,863,269 4,076,350 3,423,776 2,733,765
Notes payable and capital leases –
noncurrent 1,039,352 1,254,278 1,308,979 791,618 547,522
Stockholders’ equity(1) 891,199 744,042 895,974 1,183,411 1,068,255
OPER ATING CASH FLOW $ 297,128 $ 100,867 $ (125,872) $ (6,666) $ 51,417
(1) No cash dividends were declared in each of the years presented.
(2) See Note 3 to the Consolidated Financial Statements for discussion of acquisitions during 1997 and dispositions during 1999 affecting the comparability of
information. Additionally, the Company’s workers’ compensation segment sold in 1998 and physician practice management segment sold in 1996 have been
accounted for as discontinued operations.
(3) Certain reclassifications have been made to 1998 and 1997 Statements of Operations Data to conform to the 1999 presentation. Comparable information for 1996
and 1995 reclassifications are not available.
Financial Highlights