Hasbro 2014 Annual Report Download - page 50
Download and view the complete annual report
Please find page 50 of the 2014 Hasbro annual report below. You can navigate through the pages in the report by either clicking on the pages listed below, or by using the keyword search tool below to find specific information within the annual report.-
 1
1 -
2
-
3
-
4
-
5
-
6
-
7
-
8
-
9
-
10
-
11
-
12
-
13
-
14
-
15
-
16
-
17
-
18
-
19
-
20
-
21
-
22
-
23
-
24
-
25
-
26
-
27
-
28
-
29
-
30
-
31
-
32
-
33
-
34
-
35
-
36
-
37
-
38
-
39
-
 40
40 -
 41
41 -
 42
42 -
 43
43 -
 44
44 -
 45
45 -
 46
46 -
 47
47 -
 48
48 -
 49
49 -
 50
50 -
 51
51 -
 52
52 -
 53
53 -
 54
54 -
 55
55 -
 56
56 -
 57
57 -
 58
58 -
 59
59 -
 60
60 -
61
-
62
-
63
-
64
-
65
-
66
-
67
-
68
-
69
-
70
-
71
-
72
-
73
-
74
-
75
-
76
-
77
-
78
-
79
-
80
-
81
-
82
-
83
-
84
-
85
-
86
-
87
-
88
-
89
-
90
-
91
-
92
-
93
-
94
-
95
-
96
-
97
-
98
-
99
-
100
-
101
-
102
-
103
-
104
-
105
-
106
-
107
-
108
-
109
-
110
-
111
-
112
-
113
-
114
-
115
-
116
-
117
-
118
-
119
-
120
-
121
-
122
-
123
-
124
-
125
-
126
-
127
 |
 |

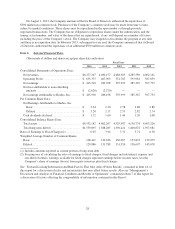
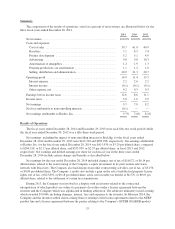
The following table presents net revenues and operating profit data for the Company’s three principal
segments for 2014, 2013 and 2012.
2014
%
Change 2013
%
Change 2012
Net Revenues
U.S. and Canada ............... $2,022,443 1% $2,006,079 (5)% $2,116,297
International .................. $2,022,997 8% $1,872,980 5% $1,782,119
Entertainment and Licensing ..... $ 219,465 15% $ 190,955 5% $ 181,430
Operating Profit
U.S. and Canada ............... $ 334,702 7% $ 313,746 (2)% $ 319,072
International .................. $ 270,505 15% $ 235,482 9% $ 215,489
Entertainment and Licensing ..... $ 60,550 33% $ 45,476 (15)% $ 53,191
U.S. and Canada
U.S. and Canada segment net revenues for the year ended December 28, 2014 increased 1% compared to
2013 and decreased 5% in 2013 compared to 2012. Net revenues in 2014 included unfavorable foreign currency
translation of approximately $5,500. The impact of currency translation was not material in 2013. In 2014, higher
net revenues from the boys’ category were almost wholly offset by lower net revenues from the games, girls’ and
preschool categories. In 2013, lower net revenues from boys and preschool products were only partially offset by
higher net revenues from girls and games products. Lower net revenues in 2013 were partially due to continued
challenging economic conditions which resulted in lower consumer spending.
In the boys’ category, higher net revenues from TRANSFORMERS, NERF, MARVEL and STAR WARS
in 2014 compared to 2013 were only partially offset by expected lower sales of BEYBLADE products. In 2013,
lower sales of MARVEL, BEYBLADE and STAR WARS products compared to 2012 more than offset slightly
higher net revenues from NERF and TRANSFORMERS products.
In the games category, higher net revenues from franchise brands, specifically MAGIC: THE GATHERING
and MONOPOLY, in 2014 compared to 2013, as well as other games brands, were more than offset by lower net
revenues from DUEL MASTERS and TWISTER, and other certain brands. In 2013, higher net revenues from
MAGIC: THE GATHERING, MONOPOLY, ELEFUN & FRIENDS, DUEL MASTERS, ANGRY BIRDS,
OPERATION and TWISTER products compared to 2012 more than offset lower net revenues from other
traditional board games.
In the girls’ category, higher net revenues from franchise brands, LITTLEST PET SHOP, MY LITTLE
PONY, NERF and PLAY-DOH, in 2014 compared to 2013 as well as higher net revenues from FURREAL
FRIENDS were more than offset by an expected decline in net revenues from FURBY products. In 2013, higher
net revenues from MY LITTLE PONY products along with the introduction of NERF REBELLE products
contributed to the category’s growth. This growth was only partially offset by lower net revenues from
LITTLEST PET SHOP, ONE DIRECTION, BABY ALIVE and FURBY products.
In the preschool category, higher net revenues from the franchise brands PLAY-DOH and
TRANSFORMERS in 2014 compared to 2013 were more than offset by lower net sales from core PLAYSKOOL
as well as key partner brands, particularly SESAME STREET, MARVEL and STAR WARS. In 2013, higher net
revenues from SESAME STREET, PLAY-DOH and PLAYSKOOL HEROES products, primarily related to the
TRANSFORMERS brand, were more than offset by lower net revenues from core PLAYSKOOL and TONKA
products.
U.S. and Canada operating profit increased 7% in 2014 compared to 2013 and decreased 2% in 2013
compared to 2012. Operating profit margin improved to 16.5% in 2014 from 15.6% in 2013 and 15.1% in 2012.
Operating profit for the year ended December 30, 2012 includes restructuring charges of $2,444. Absent these
charges, operating profit margin was 15.2% in 2012. The improvement in operating profit and operating profit
36