Hasbro 2011 Annual Report Download - page 90
Download and view the complete annual report
Please find page 90 of the 2011 Hasbro annual report below. You can navigate through the pages in the report by either clicking on the pages listed below, or by using the keyword search tool below to find specific information within the annual report.-
 1
1 -
2
-
3
-
4
-
5
-
6
-
7
-
8
-
9
-
10
-
11
-
12
-
13
-
14
-
15
-
16
-
17
-
18
-
19
-
20
-
21
-
22
-
23
-
24
-
25
-
26
-
27
-
28
-
29
-
30
-
31
-
32
-
33
-
34
-
35
-
36
-
37
-
38
-
39
-
40
-
41
-
42
-
43
-
44
-
45
-
46
-
47
-
48
-
49
-
50
-
51
-
52
-
53
-
54
-
55
-
56
-
57
-
58
-
59
-
60
-
61
-
62
-
63
-
64
-
65
-
66
-
67
-
68
-
69
-
70
-
71
-
72
-
73
-
74
-
75
-
76
-
77
-
78
-
79
-
 80
80 -
 81
81 -
 82
82 -
 83
83 -
 84
84 -
 85
85 -
 86
86 -
 87
87 -
 88
88 -
 89
89 -
 90
90 -
 91
91 -
 92
92 -
 93
93 -
 94
94 -
 95
95 -
 96
96 -
 97
97 -
 98
98 -
 99
99 -
 100
100 -
101
-
102
-
103
-
104
-
105
-
106
-
107
-
108
-
109
-
110
 |
 |

HASBRO, INC. AND SUBSIDIARIES
Notes to Consolidated Financial Statements — (Continued)
(Thousands of Dollars and Shares Except Per Share Data)
In connection with the Company’s agreement to form a joint venture with Discovery, the Company is
obligated to make future payments to Discovery under a tax sharing agreement. The Company estimates these
payments may total approximately $129,800 and may range from approximately $6,400 to $7,700 per year
during the period 2012 to 2016, and approximately $94,400 in aggregate for all years occurring thereafter. These
payments are contingent upon the Company having sufficient taxable income to realize the expected tax
deductions of certain amounts related to the joint venture.
At December 25, 2011, the Company had approximately $344,370 in outstanding inventory and tooling
purchase commitments.
Hasbro is party to certain legal proceedings, as well as certain asserted and unasserted claims. Amounts
accrued, as well as the total amount of reasonably possible losses with respect to such matters, individually and
in the aggregate, are not deemed to be material to the consolidated financial statements.
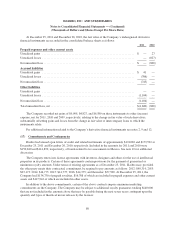
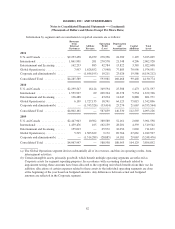
(18) Segment Reporting
Segment and Geographic Information
Hasbro is a worldwide leader in children’s and family leisure time products and services, including toys,
games and licensed products ranging from traditional to high-tech and digital. The Company’s segments are
(i) U.S. and Canada, (ii) International, (iii) Entertainment and Licensing, and (iv) Global Operations.
The U.S. and Canada segment includes the marketing and selling of boys’ action figures, vehicles and
playsets, girls’ toys, electronic toys and games, plush products, preschool toys and infant products, electronic
interactive products, toy-related specialty products, traditional board games and puzzles, DVD-based games and
trading card and role-playing games within the United States and Canada. Within the International segment, the
Company markets and sells both toy and certain game products in markets outside of the U.S. and Canada,
primarily the European, Asia Pacific, and Latin and South American regions. The Company’s Entertainment and
Licensing segment includes the Company’s lifestyle licensing, digital gaming, movie, television and online
entertainment operations. The Global Operations segment is responsible for manufacturing and sourcing finished
products for the Company’s U.S. and Canada and International segments.
Segment performance is measured at the operating profit level. Included in Corporate and eliminations are
certain corporate expenses, the elimination of intersegment transactions and certain assets benefiting more than
one segment. Intersegment sales and transfers are reflected in management reports at amounts approximating
cost. Certain shared costs, including global development and marketing expenses and corporate administration,
are allocated to segments based upon foreign exchange rates fixed at the beginning of the year, with adjustments
to actual foreign exchange rates included in Corporate and eliminations. The accounting policies of the segments
are the same as those referenced in note 1.
Results shown for fiscal years 2011, 2010 and 2009 are not necessarily those which would be achieved if
each segment was an unaffiliated business enterprise.
81