Hasbro 2011 Annual Report Download - page 42
Download and view the complete annual report
Please find page 42 of the 2011 Hasbro annual report below. You can navigate through the pages in the report by either clicking on the pages listed below, or by using the keyword search tool below to find specific information within the annual report.-
 1
1 -
2
-
3
-
4
-
5
-
6
-
7
-
8
-
9
-
10
-
11
-
12
-
13
-
14
-
15
-
16
-
17
-
18
-
19
-
20
-
21
-
22
-
23
-
24
-
25
-
26
-
27
-
28
-
29
-
30
-
31
-
 32
32 -
 33
33 -
 34
34 -
 35
35 -
 36
36 -
 37
37 -
 38
38 -
 39
39 -
 40
40 -
 41
41 -
 42
42 -
 43
43 -
 44
44 -
 45
45 -
 46
46 -
 47
47 -
 48
48 -
 49
49 -
 50
50 -
 51
51 -
 52
52 -
53
-
54
-
55
-
56
-
57
-
58
-
59
-
60
-
61
-
62
-
63
-
64
-
65
-
66
-
67
-
68
-
69
-
70
-
71
-
72
-
73
-
74
-
75
-
76
-
77
-
78
-
79
-
80
-
81
-
82
-
83
-
84
-
85
-
86
-
87
-
88
-
89
-
90
-
91
-
92
-
93
-
94
-
95
-
96
-
97
-
98
-
99
-
100
-
101
-
102
-
103
-
104
-
105
-
106
-
107
-
108
-
109
-
110
 |
 |
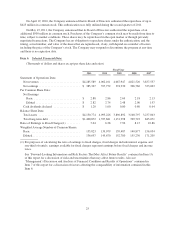
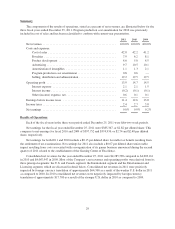
Cost of sales primarily consists of purchased materials, labor, manufacturing overheads and other inventory-
related costs such as obsolescence. Cost of sales increased to 42.8% of net revenues for the year ended
December 25, 2011 from 42.2% in 2010. The negative impacts of lower sales of traditional board games as well
as increased close-out inventory shipments in 2011 were only partially offset by the positive impact of increased
sales of entertainment-based properties, such as TRANSFORMERS and BEYBLADE products, and sales of
MAGIC: THE GATHERING products. In addition, cost of sales was negatively impacted by unfavorable
manufacturing variances as a result of reduced games production in 2011. While cost of sales as a percentage of
revenues of entertainment-based products are generally lower than many of the Company’s other products, sales
from these products, including Company owned or controlled brands based on a movie release, also incur royalty
expense. Such royalties reduce the benefit of these lower cost of sales. Additionally, costs of sales as a
percentage of net revenues of traditional board games and puzzles are generally lower. Cost of sales increased to
42.2% of net revenues for the year ended December 26, 2010 from 41.2% in 2009. The increase was partially due
to a change in the mix of revenues. Increased cost of sales as a percentage of revenues reflects a change in
product mix primarily due to decreased sales of entertainment-based products in 2010 compared to 2009.
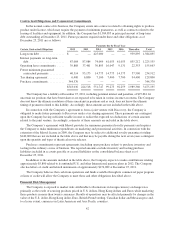
Royalty expense increased to $339,217 or 7.9% of net revenues in 2011 compared to $248,570, or 6.2% of
net revenues, in 2010 and $330,651, or 8.1% of net revenues, in 2009. The increase in 2011 and the decrease in
2010 primarily reflect the higher sales of entertainment-driven products in 2011, primarily BEYBLADE and
TRANSFORMERS products, and 2009, namely TRANSFORMERS and G.I. JOE products.
Product development expense in 2011 totaled $197,638, or 4.6% of net revenues, compared to $201,358, or
5.0% of net revenues, in 2010 and $181,195, or 4.5% of net revenues, in 2009. Product development expense for
2011 includes approximately $6,800 related to the reorganization of the games business. Excluding the impact of
the games reorganization, the lower 2011 expense reflects the Company’s focus on leveraging its development
efforts on larger, global brands. The increased expense in 2010 reflects higher costs associated with the
development of products introduced in 2011, including products related to the Company’s agreement with
Sesame Workshop.
Advertising expense in 2011 totaled $413,951, or 9.7% of net revenues, compared to $420,651, or 10.5% of
net revenues, in 2010 and $412,580, or 10.1% of net revenues, in 2009. Lower advertising expense in 2011 and
2009 reflects the increased volume in sales of entertainment-based properties, primarily TRANSFORMERS and
BEYBLADE products in 2011 and TRANSFORMERS and G.I. JOE products in 2009, which do not require the
same level of advertising that the Company spends on non-entertainment based products. In addition, the
increase in 2010 reflects a lower revenue base due to the decline in U.S. sales late in the year as well as increased
advertising rates in 2010.
Amortization of intangibles decreased to $46,647, or 1.1% of net revenues, in 2011 compared to $50,405, or
1.3% of net revenues, in 2010. The decrease in 2011 is the result of certain properties becoming fully amortized
during 2010. Amortization expense decreased to $50,405 or 1.3% of net revenues in 2010 compared to $85,029
or 2.1% of net revenues in 2009. The decrease in 2010 is the result of property rights related to Wizards of the
Coast becoming fully amortized in the fourth quarter of 2009.
Program production cost amortization increased to $35,798 or 0.8% of net revenues in 2011 compared to
$22,069 or 0.6% of net revenues in 2010. Program production costs are capitalized as incurred and amortized
using the individual-film-forecast method. The Company did not begin amortizing program production costs
until the third quarter of 2010, upon the initial distribution of its television programming. Accordingly, the
increase in 2011 primarily reflects four quarters of activity whereas the comparable period of 2010 includes two
quarters of activity.
Selling, distribution and administration expenses increased in dollars, however decreased as a percentage of
revenues in 2011 compared to 2010. These expenses were $822,094, or 19.2% of net revenues, compared to
$781,192, or 19.5% of net revenues, in 2010. The 2011 amount includes approximately $7,600 of costs related to
the reorganization of Company’s games business. The remaining increase primarily reflects increased shipping
costs related to higher revenues as well as increased expenses from the Company’s investments in emerging
markets, on-line operations, licensing, entertainment and its internal systems. These increases were partially
33