Hasbro 2007 Annual Report Download - page 75
Download and view the complete annual report
Please find page 75 of the 2007 Hasbro annual report below. You can navigate through the pages in the report by either clicking on the pages listed below, or by using the keyword search tool below to find specific information within the annual report.-
 1
1 -
2
-
3
-
4
-
5
-
6
-
7
-
8
-
9
-
10
-
11
-
12
-
13
-
14
-
15
-
16
-
17
-
18
-
19
-
20
-
21
-
22
-
23
-
24
-
25
-
26
-
27
-
28
-
29
-
30
-
31
-
32
-
33
-
34
-
35
-
36
-
37
-
38
-
39
-
40
-
41
-
42
-
43
-
44
-
45
-
46
-
47
-
48
-
49
-
50
-
51
-
52
-
53
-
54
-
55
-
56
-
57
-
58
-
59
-
60
-
61
-
62
-
63
-
64
-
 65
65 -
 66
66 -
 67
67 -
 68
68 -
 69
69 -
 70
70 -
 71
71 -
 72
72 -
 73
73 -
 74
74 -
 75
75 -
 76
76 -
 77
77 -
 78
78 -
 79
79 -
 80
80 -
 81
81 -
 82
82 -
 83
83 -
 84
84 -
 85
85 -
86
-
87
-
88
-
89
-
90
-
91
-
92
-
93
-
94
-
95
-
96
-
97
-
98
-
99
-
100
 |
 |

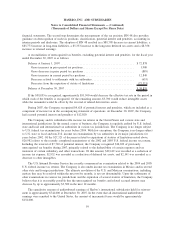
with further limitations of risk as related to investments in a single security, portfolio turnover and credit
quality.
With the exception of the alternative investment strategy mentioned above, the Plans’ Investment Policy
restricts the use of derivatives associated with leverage or speculation. In addition, the Investment Policy also
restricts investments in securities issued by Hasbro, Inc. except through index-related strategies (e.g. an S&P
500 Index Fund) and/or commingled funds. In addition, unless specifically approved by the Investment
Committee (which is comprised of members of management, established by the Board to manage and control
pension plan assets), certain securities, strategies, and investments are ineligible for inclusion within the Plans.
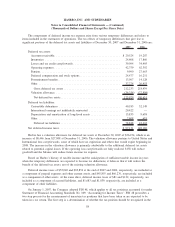
As noted above, in 2007, the Company adopted the measurement date provision of SFAS 158 and,
accordingly, measured its liabilities and related assets at December 30. Prior to this, the Company measured
its liabilities and related assets at September 30. The discount rates used in the pension calculation were also
used for the postretirement calculation.
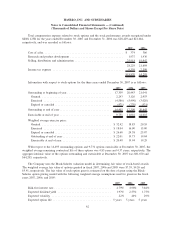
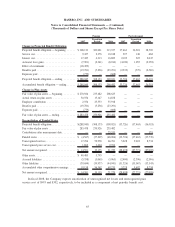
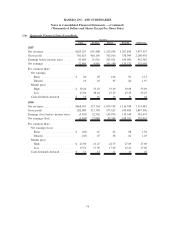
2007 2006 2005
Components of Net Periodic Cost
Pension
Service cost.......................................... $ 9,437 10,188 9,384
Interest cost.......................................... 17,435 16,809 15,526
Expected return on assets ................................ (23,064) (19,112) (16,275)
Amortization of prior service cost ......................... 634 596 582
Amortization of actuarial loss ............................ 1,768 3,399 2,554
Curtailment loss ...................................... 908 — —
Net periodic benefit cost ................................ $ 7,118 11,880 11,771
Postretirement
Service cost.......................................... $ 597 684 573
Interest cost.......................................... 2,105 2,047 2,003
Amortization of actuarial loss ............................ 364 459 354
Net periodic benefit cost ................................ $ 3,066 3,190 2,930
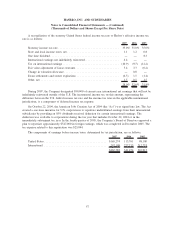
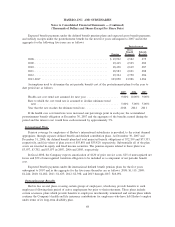
Assumptions used to determine net periodic benefit cost of the pension plans for each fiscal year follow:
2007 2006 2005
Weighted average discount rate ................................... 5.83% 5.50% 5.75%
Rate of future compensation increases .............................. 4.00% 4.00% 4.00%
Long-term rate of return on plan assets .............................. 8.75% 8.75% 8.75%
Hasbro works with external benefit investment specialists to assist in the development of the long-term
rate of return assumptions used to model and determine the overall asset allocation. Forecast returns are based
on the combination of historical returns, current market conditions and a forecast for the capital markets for
the next 5-7 years. Approximately 75% of the return assumption is based on the historical information and
25% is based on current or forward-looking information. All asset class assumptions are within certain bands
around the long-term historical averages. Correlations are based primarily on historical return patterns.
67
HASBRO, INC. AND SUBSIDIARIES
Notes to Consolidated Financial Statements — (Continued)
(Thousands of Dollars and Shares Except Per Share Data)