Harris Teeter 2009 Annual Report Download - page 2
Download and view the complete annual report
Please find page 2 of the 2009 Harris Teeter annual report below. You can navigate through the pages in the report by either clicking on the pages listed below, or by using the keyword search tool below to find specific information within the annual report.-
 1
1 -
 2
2 -
 3
3 -
 4
4 -
 5
5 -
 6
6 -
 7
7 -
 8
8 -
 9
9 -
 10
10 -
 11
11 -
 12
12 -
 13
13 -
14
-
15
-
16
-
17
-
18
-
19
-
20
-
21
-
22
-
23
-
24
-
25
-
26
-
27
-
28
-
29
-
30
-
31
-
32
-
33
-
34
-
35
-
36
-
37
-
38
-
39
-
40
-
41
-
42
-
43
-
44
-
45
-
46
-
47
-
48
-
49
-
50
-
51
-
52
-
53
-
54
-
55
-
56
-
57
-
58
-
59
-
60
-
61
-
62
-
63
-
64
-
65
-
66
-
67
-
68
-
69
-
70
-
71
-
72
-
73
-
74
-
75
-
76
-
77
-
78
-
79
-
80
-
81
-
82
-
83
-
84
-
85
-
86
-
87
-
88
-
89
-
90
-
91
-
92
-
93
-
94
-
95
-
96
-
97
-
98
-
99
-
100
-
101
-
102
-
103
-
104
-
105
-
106
-
107
-
108
-
109
-
110
-
111
-
112
-
113
-
114
-
115
-
116
-
117
-
118
-
119
 |
 |

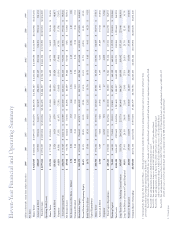
(dollars in thousands, except share and per share data) 20091 2008 2007 2006 2005 20041,2 20031 20021 20011 2000 19992
Net Sales
Harris Teeter $ 3,827,005 $ 3,664,804 $ 3,299,377 $ 2,922,679 $ 2,644,976 $ 2,572,367 $ 2,431,632 $ 2,349,650 $ 2,416,799 $ 2,332,908 $ 2,273,156
American & Erd 250,817 327,593 339,831 343,177 319,679 296,230 293,107 294,548 326,491 359,183 361,133
Total Net Sales $ 4,077,822 $ 3,992,397 $ 3,639,208 $ 3,265,856 $ 2,964,655 $ 2,868,597 $ 2,724,739 $ 2,644,198 $ 2,743,290 $ 2,692,091 $ 2,634,289
Operating Prot (Loss)
Harris Teeter $ 175,591 $ 177,765 $ 154,083 $ 127,637 $ 113,580 $ 104,406 $ 93,622 $ 88,773 $ 31,802 $ 59,146 $ 55,438
American & Erd (14,621) 2,328 1,424 1,579 9,010 13,073 13,624 12,495 21,635 47,478 48,617
Corporate (6,119) (6,308) (7,333) (6,147) (7,330) (5,065) (5,134) (7,466) (4,735) (7,178) (7,507)
Total Operating Prot $ 154,851 $ 173,785 $ 148,174 $ 123,069 $ 115,260 $ 112,414 $ 102,112 $ 93,802 $ 48,702 $ 99,446 $ 96,548
Net Income (Loss) $ 85,964 $ 96,752 $ 80,688 $ 72,336 $ 68,598 $ 64,659 $ 59,882 $ 51,983 $ (727) $ 51,002 $ 50,714
Net Income (Loss) Per Share — Diluted 1.78 2.00 1.68 1.52 1.44 1.38 1.29 1.12 (0.02) 1.10 1.08
Common Dividend 0.48 0.48 0.44 0.44 0.44 0.40 0.36 0.36 0.36 0.36 0.33
Shareholders’ Equity $ 812,179 $ 823,835 $ 736,610 $ 670,517 $ 608,942 $ 549,710 $ 495,265 $ 457,688 $ 445,353 $ 473,005 $ 443,683
Percent Return on Beginning Equity 10.4% 13.1% 12.0% 11.9% 12.5% 13.1% 13.1% 11.7% (0.2%) 11.5% 12.3%
Book Value Per Share $ 16.73 $ 17.06 $ 15.31 $ 14.10 $ 12.82 $ 11.76 $ 10.71 $ 9.85 $ 9.61 $ 10.23 $ 9.55
Capital Expenditures
Harris Teeter $ 206,701 $ 192,224 $ 205,474 $ 210,336 $ 115,423 $ 83,941 $ 64,370 $ 66,591 $ 68,525 $ 98,973 $ 77,513
American & Erd 2,500 7,269 7,666 7,626 13,552 8,104 9,197 7,833 19,169 19,744 15,658
Corporate 27 6,763 574 25 47 14 4,692 27 38 3,766
Total Capital Expenditures $ 209,203 $ 199,500 $ 219,903 $ 218,536 $ 129,000 $ 92,092 $ 73,581 $ 79,116 $ 87,721 $ 118,755 $ 96,937
Working Capital $ 71,421 $ 66,353 $ 73,494 $ 98,119 $ 130,811 $ 187,971 $ 165,192 $ 165,911 $ 112,272 $ 138,091 $ 124,060
Total Assets 1,844,321 1,696,407 1,529,689 1,362,936 1,203,640 1,109,097 1,065,022 1,039,271 940,064 1,020,684 969,924
Long-Term Debt — Including Current Portion 365,087 320,578 264,392 237,731 163,445 166,287 189,095 185,892 157,113 227,940 198,961
Long-Term Debt as a Percent of Capital Employed 30.8% 27.9% 26.3% 26.0% 21.0% 23.0% 27.3% 28.5% 25.7% 32.1% 30.7%
Number of Employees 24,800 25,500 24,800 22,400 20,400 18,200 17,500 17,650 17,100 20,000 19,800
Common Shares Outstanding 48,545,080 48,278,136 48,127,252 47,557,894 47,488,979 46,730,758 46,223,233 46,454,188 46,319,696 46,220,876 46,451,240
Eleven-Year Financial and Operating Summary
1 Operating Profit, Net Income, Net Income Per Share — Diluted and related returns include the following exit and impairment charges and tax settlement, which have been
previously disclosed in the Company’s annual reports on Form 10-K:
Fiscal 2009: Non-cash charges of $9,891 ($6,099 after tax benefits, or $0.13 per diluted share) related to goodwill and long-lived asset impairments recognized by A&E.
Fiscal 2004: Exit and impairment charges at A&E of $384 ($238 after taxes).
Fiscal 2003: Exit and impairment charges at A&E of $580 ($360 after taxes, or $0.01 per diluted share).
Fiscal 2002: Exit and impairment credits at Harris Teeter of $710 ($431 after taxes, or $0.01 per diluted share)
and exit and impairment charges at A&E of $7,823 ($4,825 after taxes, or $0.10 per diluted share).
Fiscal 2001: Exit and impairment charges at Harris Teeter of $45,035 ($27,370 after taxes, or $0.59 per diluted share), exit and impairment charges at A&E of $2,105
($1,285 after taxes, or $0.03 per diluted share) and a tax settlement with the IRS for $20,000 ($0.43 per diluted share).
2 53-week year.