Harris Teeter 2006 Annual Report Download - page 3
Download and view the complete annual report
Please find page 3 of the 2006 Harris Teeter annual report below. You can navigate through the pages in the report by either clicking on the pages listed below, or by using the keyword search tool below to find specific information within the annual report.-
 1
1 -
 2
2 -
 3
3 -
 4
4 -
 5
5 -
 6
6 -
 7
7 -
 8
8 -
 9
9 -
 10
10 -
 11
11 -
 12
12 -
 13
13
 |
 |

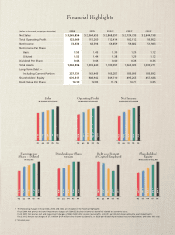
1 The historical Net Sales and Operating Profit for fiscal 1996 does not include the Sales and Operating Profit of Jordan Graphics
Inc. which was discontinued in fiscal 1996.
2 Operating Profit, Net Income, Net Income Per Share — Diluted and related returns include the following exit and impairment
charges and tax settlement, which have been previously disclosed in the Company’s annual reports on Form 10-K:
Fiscal 2004: Exit and impairment charges at A&E of $384 ($238 after taxes).
Fiscal 2003: Exit and impairment charges at A&E of $580 ($360 after taxes, or $0.01 per diluted share).
Fiscal 2002: Exit and impairment credits at Harris Teeter of $710 ($431 after taxes, or $0.01 per diluted share)
and exit and impairment charges at A&E of $7,823 ($4,825 after taxes, or $0.10 per diluted share).
Fiscal 2001: Exit and impairment charges at Harris Teeter of $45,035 ($27,370 after taxes, or $0.59 per diluted share), exit and
impairment charges at A&E of $2,105 ($1,285 after taxes, or $0.03 per diluted share) and a tax settlement with the
IRS for $20,000 ($0.43 per diluted share).
3 53-week year.
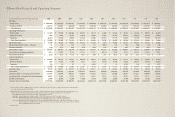
Eleven-Year Financial and Operating Summary
(dollars in thousands, except share and per share data) 2006 2005 20042,3 2003220022200122000 199931998 1997 1996
Net Sales1
Harris Teeter $ 2,922,679 $ 2,644,976 $ 2,572,367 $ 2,431,632 $ 2,349,650 $ 2,416,799 $ 2,332,908 $ 2,273,156 $ 2,132,223 $ 1,931,212 $ 1,833,042
American & Efird 343,177 319,679 296,230 293,107 294,548 326,491 359,183 361,133 365,184 378,723 317,261
Total Net Sales $ 3,265,856 $ 2,964,655 $ 2,868,597 $ 2,724,739 $ 2,644,198 $ 2,743,290 $ 2,692,091 $ 2,634,289 $ 2,497,407 $ 2,309,935 $ 2,150,303
Operating Profit (Loss)1
Harris Teeter $ 127,637 $ 113,580 $ 104,406 $ 93,622 $ 88,773 $ 31,802 $ 59,146 $ 55,438 $ 52,126 $ 45,671 $ 48,459
American & Efird 1,579 9,010 13,073 13,624 12,495 21,635 47,478 48,617 42,070 49,165 34,684
Corporate (6,147) (7,330) (5,065) (5,134) (7,466) (4,735) (7,178) (7,507) (7,770) (9,794) (10,109)
Total Operating Profit $ 123,069 $ 115,260 $ 112,414 $ 102,112 $ 93,802 $ 48,702 $ 99,446 $ 96,548 $ 86,426 $ 85,042 $ 73,034
Net Income (Loss) $ 72,336 $ 68,598 $ 64,659 $ 59,882 $ 51,983 $ (727) $ 51,002 $ 50,714 $ 46,772 $ 47,731 $ 42,802
Net Income (Loss) Per Share — Diluted 1.52 1.44 1.38 1.29 1.12 (0.02) 1.10 1.08 1.00 1.02 0.92
Common Dividend 0.44 0.44 0.40 0.36 0.36 0.36 0.36 0.33 0.32 0.32 0.26
Shareholders’ Equity $ 670,517 $ 608,942 $ 549,710 $ 495,265 $ 457,688 $ 445,353 $ 473,005 $ 443,683 $ 410,725 $ 380,507 $ 346,856
Percent Return on Beginning Equity 11.9% 12.5% 13.1% 13.1% 11.7% (0.2%) 11.5% 12.3% 12.3% 13.8% 13.5%
Book Value Per Share $ 14.10 $ 12.82 $ 11.76 $ 10.71 $ 9.85 $ 9.61 $ 10.23 $ 9.55 $ 8.82 $ 8.17 $ 7.47
Capital Expenditures
Harris Teeter $ 210,336 $ 115,423 $ 83,941 $ 64,370 $ 66,591 $ 68,525 $ 98,973 $ 77,513 $ 75,082 $ 86,237 $ 83,204
American & Efird 7,626 13,552 8,104 9,197 7,833 19,169 19,744 15,658 20,246 28,878 35,605
Corporate 574 25 47 14 4,692 27 38 3,766 145 184 4,471
Total Capital Expenditures $ 218,536 $ 129,000 $ 92,092 $ 73,581 $ 79,116 $ 87,721 $ 118,755 $ 96,937 $ 95,473 $ 115,299 $ 123,280
Working Capital $ 98,119 $ 130,811 $ 187,971 $ 165,192 $ 165,911 $ 112,272 $ 138,091 $ 124,060 $ 87,333 $ 88,893 $ 65,134
Total Assets 1,362,936 1,203,640 1,109,097 1,065,022 1,039,271 940,064 1,020,684 969,924 931,544 885,243 801,702
Long-Term Debt — Including Current Portion 237,731 163,445 166,287 189,095 185,892 157,113 227,940 198,961 191,931 190,494 164,435
Long-Term Debt as a Percent of Capital Employed 26.0% 21.0% 23.0% 27.3% 28.5% 25.7% 32.1% 30.7% 31.6% 33.1% 32.2%
Number of Employees 22,400 20,400 18,200 17,500 17,650 17,100 20,000 19,800 20,700 19,700 20,100
Common Shares Outstanding 47,557,894 47,488,979 46,730,758 46,223,233 46,454,188 46,319,696 46,220,876 46,451,240 46,554,591 46,599,301 46,461,290