Harris Teeter 2006 Annual Report Download - page 2
Download and view the complete annual report
Please find page 2 of the 2006 Harris Teeter annual report below. You can navigate through the pages in the report by either clicking on the pages listed below, or by using the keyword search tool below to find specific information within the annual report.-
 1
1 -
 2
2 -
 3
3 -
 4
4 -
 5
5 -
 6
6 -
 7
7 -
 8
8 -
 9
9 -
 10
10 -
 11
11 -
 12
12 -
 13
13
 |
 |

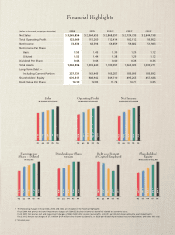
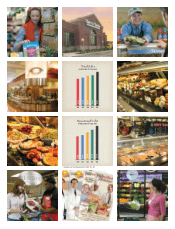
Debt as a Percent
of Capital Employed
Dividends per Share
IN DOLLARS
Sales
IN BILLIONS OF DOLLARS
Operating Profit
IN MILLIONS OF DOLLARS
Net Income
IN MILLIONS OF DOLLARS
Shareholders’
Equity
IN MILLIONS OF DOLLARS
Earnings per
Share – Diluted
IN DOLLARS
04
2.64
2.72
2.87
05
2.96
02 03 04 0502 03 04 0502 03
93.8
102.1
112.4
115.3
52.0
59.9
64.7
68.6
0.36
0.36
0.40
0.44
1.1 2
1.2 9
1.3 8
1.4 4
28.5
27.3
23.0
21.0
04 0502 03 04 0502 03 04 0502 03 04 05
06
3.27
06 06
123.1
72.3
0.44
1.5 2
26.0
06 06 06 0602 03
457.7
495.3
549.7
608.9
670.5
1 The following charges in fiscal 2004, 2003, and 2002 are included in the financial highlights:
Fiscal 2004: Net pre-tax exit and impairment charges of $384 ($238 after income tax benefits) related to severance costs.
Fiscal 2003: Net pre-tax
exit and impairment
charges of $580 ($360 after income tax benefits, or $0.01 per diluted share) related to asset impairments.
Fiscal 2002: Net pre-tax charges of $7.1 million ($4.4 million after income tax benefits, or $0.09 per diluted share) related to asset impairments and other exit costs.
2 53-week year.
Financial Highlights
(dollars in thousands, except per share data) 2006 2005 20041,2 2003120021
Net Sales $ 3,265,856 $ 2,964,655 $ 2,868,597 $ 2,724,739 $ 2,644,198
Total Operating Profit 123,069 115,260 112,414 102,112 93,802
Net Income 72,336 68,598 64,659 59,882 51,983
Net Income Per Share
Basic 1.53 1.45 1.39 1.29 1.12
Diluted 1.52 1.44 1.38 1.29 1.12
Dividend Per Share 0.44 0.44 0.40 0.36 0.36
Total Assets 1,362,936 1,203,640 1,109,097 1,065,022 1,039,271
Long-Term Debt
—
Including Current Portion 237,731 163,445 166,287 189,095 185,892
Shareholders’ Equity 670,517 608,942 549,710 495,265 457,688
Book Value Per Share 14.10 12.82 11.76 10.71 9.85