Harris Teeter 1999 Annual Report Download - page 7
Download and view the complete annual report
Please find page 7 of the 1999 Harris Teeter annual report below. You can navigate through the pages in the report by either clicking on the pages listed below, or by using the keyword search tool below to find specific information within the annual report.
Ruddick Corporation Financial Highlights
3
1999 Annual Report
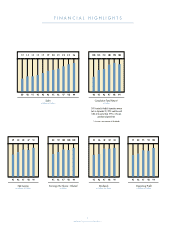
EBITDA
In Millions of Dollars
95 96 97 98 99
114 125 145 153 167
Book Value
In Dollars Per Share
95 96 97 98 99
6.82 7.47 8.17 8.82 9.55
Debt as a Percent of
Capital Employed
95 96 97 98 99
29.0 32.2 33.1 30.7
Shareholders’ Equity
In Millions of Dollars
95 96 97 98 99
316 347 381 411 444
(Dollars in thousands, except per share data) 1999 1998 1997 1996 1995
Net Sales $2,624,774 $2,487,370 $2,300,089 $2,142,501 $2,009,776
Total Operating Profit 104,055 94,196 94,836 83,143 76,728
Earnings Before Interest,
Taxes, Depreciation and
Amortization (EBITDA) 166,699 152,851 144,583 125,390 114,385
Net Income 50,714 46,772 47,731 42,802 39,267
Net Income Per Share
Basic 1.09 1.00 1.02 .92 .84
Diluted 1.08 1.00 1.02 .92 .84
Dividend Per Share .33 .32 .32 .26 .25
Total Assets 970,114 931,618 885,243 801,702 715,318
Shareholders’ Equity 443,683 410,725 380,507 346,856 316,236
Book Value Per Share 9.55 8.82 8.17 7.47 6.82
31.6

