Harris Teeter 1999 Annual Report Download - page 6
Download and view the complete annual report
Please find page 6 of the 1999 Harris Teeter annual report below. You can navigate through the pages in the report by either clicking on the pages listed below, or by using the keyword search tool below to find specific information within the annual report.-
 1
1 -
 2
2 -
 3
3 -
 4
4 -
 5
5 -
 6
6 -
 7
7 -
 8
8 -
 9
9 -
 10
10 -
 11
11 -
 12
12 -
 13
13 -
 14
14 -
 15
15 -
 16
16 -
 17
17 -
18
-
19
-
20
-
21
-
22
 |
 |

2
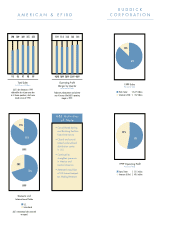
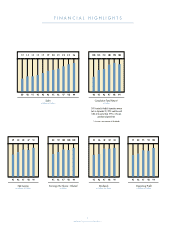
Ruddick Corporation and Subsidiaries
Net Income
In Millions of Dollars
95 96 97 98 99
39 43 48 47 51
Earnings Per Share – Diluted
In Dollars
95 96 97 98 99
.84 .92 1.02 1.00 1.08
Sales
In Billions of Dollars
89 90 91 92 93 94 95 96 97 98
1.2 1.4 1.4 1.5 1.7
Dividends
In Dollars Per Share
95 96 97 98 99
.25 .26 .32 .32 .33
Operating Profit
In Millions of Dollars
95 96 97 98 99
77 83 95 94 104
1.9 2.0 2.1 2.3 2.5
99
2.6
Cumulative Total Return*
In Dollars
$100 invested in Ruddick Corporation common
stock on September 30, 1994 would be worth
$184 at the end of fiscal 1999, a 13% com-
pound annual growth rate.
* Assumes reinvestment of dividends
94 95 96 97 98 99
100 145 151 180 193 184
FINANCIAL HIGHLIGHTS