Harris Teeter 1997 Annual Report Download - page 11
Download and view the complete annual report
Please find page 11 of the 1997 Harris Teeter annual report below. You can navigate through the pages in the report by either clicking on the pages listed below, or by using the keyword search tool below to find specific information within the annual report.-
 1
1 -
 2
2 -
 3
3 -
 4
4 -
 5
5 -
 6
6 -
 7
7 -
 8
8 -
 9
9 -
 10
10 -
 11
11 -
 12
12 -
 13
13 -
 14
14 -
 15
15 -
 16
16 -
 17
17 -
 18
18 -
 19
19 -
 20
20 -
 21
21 -
 22
22 -
23
-
24
-
25
-
26
-
27
-
28
-
29
-
30
-
31
-
32
-
33
-
34
-
35
-
36
 |
 |

Even Better
1997 ANNUAL REPORT
9
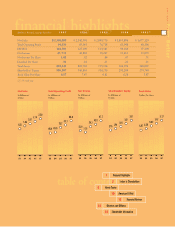
Total Store Space
In Millions of
Square Feet
Since 1993, Harris Teeter’s
store space has increased more
than 24% due to an increase
in store openings and in average
store square footage.
Average Weekly Sales
Per Store
In Thousands of
Dollars
In 1997, Harris Teeter experienced
a 5.3% increase in average weekly
sales per store.
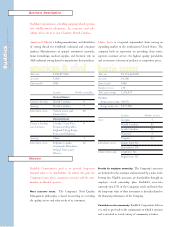
“Harris Teeter stands out in the competitive
supermarket industry by offering superior
service and greater selection.”
Fred J. Morganthall, II
President
Harris Teeter
93 94 95 96 97
4.21 4.31
4.68 4.86
5.25
EBITDA
In Millions of
Dollars
Harris Teeter’s EBITDA
has grown in each of the past
five years.
93 94 95 96 97
57.1
65.9
73.8
86.0 88.2
93 94 95 96 97
198
223 235
259 273