Hamilton Beach 2013 Annual Report Download - page 22
Download and view the complete annual report
Please find page 22 of the 2013 Hamilton Beach annual report below. You can navigate through the pages in the report by either clicking on the pages listed below, or by using the keyword search tool below to find specific information within the annual report.-
 1
1 -
2
-
3
-
4
-
5
-
6
-
7
-
8
-
9
-
10
-
11
-
 12
12 -
 13
13 -
 14
14 -
 15
15 -
 16
16 -
 17
17 -
 18
18 -
 19
19 -
 20
20 -
 21
21 -
 22
22 -
 23
23 -
 24
24 -
 25
25
 |
 |

20
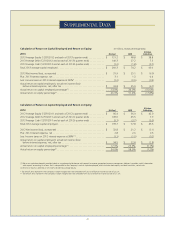
Calculation of Return on Capital Employed and Return on Equity:
2013
2013 Average Equity (12/31/2012 and each of 2013’s quarter ends) . . . . . . . . . . . .
2013 Average Debt (12/31/2012 and at each of 2013’s quarter ends) . . . . . . . . . . .
2013 Average Cash (12/31/2012 and at each of 2013’s quarter ends) . . . . . . . . . . .
Total 2013 average capital employed . . . . . . . . . . . . . . . . . . . . . . . . . . . . . . . . . . . .
2013 Net income (loss), as reported . . . . . . . . . . . . . . . . . . . . . . . . . . . . . . . . . . . . .
Plus: 2013 Interest expense, net . . . . . . . . . . . . . . . . . . . . . . . . . . . . . . . . . . . . . . . .
Less: Income taxes on 2013 interest expense at 38%* . . . . . . . . . . . . . . . . . . . . . . .
Actual return on capital employed = actual net income (loss)
before interest expense, net, after tax . . . . . . . . . . . . . . . . . . . . . . . . . . . . . . . . .
Actual return on capital employed percentage(1) . . . . . . . . . . . . . . . . . . . . . . . . . . . .
Actual return on equity percentage(2) . . . . . . . . . . . . . . . . . . . . . . . . . . . . . . . . . . . . .
HBB
$ 48.8
27.2
(1.8)
$ 74.2
$ 25.1
1.3
(0.5)
$ 25.9
34.9%
51.4%
NACoal
$ 121.2
140.3
(1.2)
$ 260.3
$ 31.9
3.1
(1.2)
$ 33.8
13.0%
26.3%
Calculation of Return on Capital Employed and Return on Equity:
2012
2012 Average Equity (12/31/2011 and each of 2012’s quarter ends) . . . . . . . . . . . .
2012 Average Debt (12/31/2011 and at each of 2012’s quarter ends) . . . . . . . . . . .
2012 Average Cash (12/31/2011 and at each of 2012’s quarter ends) . . . . . . . . . . .
Total 2012 average capital employed . . . . . . . . . . . . . . . . . . . . . . . . . . . . . . . . . . . .
2012 Net income (loss), as reported . . . . . . . . . . . . . . . . . . . . . . . . . . . . . . . . . . . . .
Plus: 2012 Interest expense, net . . . . . . . . . . . . . . . . . . . . . . . . . . . . . . . . . . . . . . . .
Less: Income taxes on 2012 interest expense at 38%**. . . . . . . . . . . . . . . . . . . . . .
Actual return on capital employed = actual net income (loss)
before interest expense, net, after tax . . . . . . . . . . . . . . . . . . . . . . . . . . . . . . . . .
Actual return on capital employed percentage(1) . . . . . . . . . . . . . . . . . . . . . . . . . . . .
Actual return on equity percentage(2) . . . . . . . . . . . . . . . . . . . . . . . . . . . . . . . . . . . . .
Kitchen
Collection
$ 38.8
7.3
(3.1)
$ 43.0
$ (6.9)
0.4
(0.2)
$ (6.7)
(15.6%)
(17.8%)
Kitchen
Collection
$ 42.9
7.9
(5.3)
$ 45.5
$ (3.1)
0.5
(0.2)
$ (2.8)
(6.1%)
(7.2%)
HBB
$ 36.0
45.5
(3.7)
$ 77.8
$ 21.2
2.6
(1.0)
$ 22.8
29.3%
58.9%
NACoal
$ 96.4
109.0
(5.7)
$ 199.7
$ 32.8
2.8
(1.1)
$ 34.5
17.3%
34.0%
(In millions, except percentage data)
(1) Return on capital employed is provided solely as a supplemental disclosure with respect to income generation because management believes it provides useful information
with respect to earnings in a form that is comparable to the Company’s cost of capital employed, which includes both equity and debt securities, net of cash.
(2) Return on equity is defined as net income divided by average equity.
* Tax rate of 38% represents the Company’s target marginal tax rate compared with 2013’s effective income tax rate of 20.2%.
** Tax rate of 38% represents the Company’s target marginal tax rate compared with 2012’s effective income tax rate of 27.3%.
SUPPLEMENTAL DATA