Graco 2009 Annual Report Download - page 5
Download and view the complete annual report
Please find page 5 of the 2009 Graco annual report below. You can navigate through the pages in the report by either clicking on the pages listed below, or by using the keyword search tool below to find specific information within the annual report.-
 1
1 -
 2
2 -
 3
3 -
 4
4 -
 5
5 -
 6
6 -
 7
7 -
 8
8 -
 9
9 -
 10
10 -
 11
11 -
 12
12 -
 13
13 -
 14
14 -
 15
15 -
 16
16 -
17
-
18
-
19
-
20
-
21
-
22
-
23
-
24
-
25
-
26
-
27
-
28
-
29
-
30
-
31
-
32
-
33
-
34
-
35
-
36
-
37
-
38
-
39
-
40
-
41
-
42
-
43
-
44
-
45
-
46
-
47
-
48
-
49
-
50
-
51
-
52
-
53
-
54
-
55
-
56
-
57
-
58
-
59
-
60
-
61
-
62
-
63
-
64
-
65
-
66
-
67
-
68
-
69
-
70
-
71
-
72
-
73
-
74
-
75
-
76
-
77
-
78
-
79
-
80
-
81
-
82
-
83
-
84
-
85
-
86
 |
 |

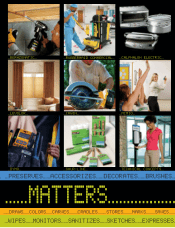
3
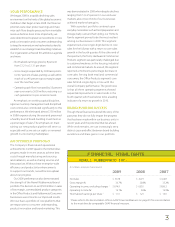
………………………FINANCIAL HIGHLIGHTS……………………………………
……………NEWELL RUBBERMAID INC.…………………………………………………………
SOLID PERFORMANCE
We began 2009 in a rapidly declining sales
environment on the heels of the global economic
meltdown that began in late 2008. Our nancial
priorities were clear: protect earnings and maxi-
mize cash ow, despite pressures from inevitable
revenue declines. Even more importantly, we
were determined to preserve investments in new
product innovation and consumer understanding
to keep the momentum we had worked so hard to
establish in our strategic brand-building initiatives.
Our organization achieved this ambitious agenda
and more.
• Normalized earnings grew by 8 percent
from $1.21 to $1.31 per share.
• Gross margin expanded by 390 basis points
to 36.7 percent of sales, putting us well within
reach of our 40 percent gross margin target
over the next few years.
• Operating cash ow increased by 33 percent
year-over-year to $603 million, restoring our
cash generation to pre-recession levels.
An emphasis on working capital discipline,
rigorous inventory management and disciplined
cost control also contributed signi cantly to this
performance. We eliminated almost $130 million
in SG&A expense during the year and preserved
a healthy level of brand-building investment as
a percentage of sales. The emphasis on main-
taining our new product pipeline will serve us
especially well as we set our sights on renewed
growth in a recovering marketplace.
AN OPTIMIZED PORTFOLIO
The Company’s nancial and operational
achievements in 2009 speak to the tremendous
progress made in recent years to achieve best
costs through manufacturing and sourcing
rationalization, as well as sharing services and
best practices. Without these enterprise-wide
e ciency and productivity enhancements
to support our brands, I would be less upbeat
about our progress.
Our 2009 performance also demonstrated
the strength of the Newell Rubbermaid brand
portfolio. The decision to exit $500 million in sales
of low-margin, commoditized product categories
in the O ce Products and Rubbermaid Consumer
businesses was critical to our improved results.
We now have a portfolio of core platforms that
are responsive to consumer understanding,
product innovation and brand marketing. This
was demonstrated in 2009 when despite declines
ranging from 5 to 25 percent in our end-user
markets, about two-thirds of our businesses
achieved market share gains.
With a product portfolio centered upon
everyday necessities such as food preparation and
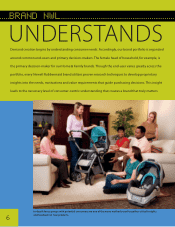
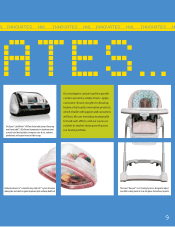
storage, baby care and hair styling, our Home &
Family segment proved to be the most resilient
among our businesses in 2009. This segment
experienced a low-single-digit decline in core
sales for the full year, with a return to core sales
growth in the fourth quarter. At the other end of
the spectrum, the Tools, Hardware & Commercial
Products segment was particularly challenged due
to sustained weakness in the housing, industrial
and commercial markets. As a result, this segment
reported a mid-teens-percentage decrease in
core sales. Serving both retail and commercial
consumers, the O ce Products segment’s core
sales fell mid-single digits, in line with the
overall Company performance. The good news
is that all three operating segments showed
sequential improvement in sales trends in the
fourth quarter, which we believe to be a leading
indicator of a return to growth in 2010.
BRAND BUILDING SUCCESS
Though these nancial results tell the story of the
past year, they do not fully impart the progress
that has been made within our business units in
recent years and the potential that lies ahead.
While work remains, we can increasingly see a
distinct cause and e ect between brand-building
excellence and share gains in our portfolio.
($ in millions, except per share amounts)
2009 2008 2007
Net Sales $ 5,578 $ 6,471 $ 6,407
Gross margin % 36.7% 32.8% 35.2%
Operating Income, excluding charges 1 $ 674.9 $ 620.5 $ 826.3
Operating Income % 1 12.1% 9.6% 12.9%
“Normalized” earnings per share 1 $ 1.31 $ 1.21 $ 1.81
1 Please refer to the Reconciliation of Non-GAAP Financial Measures on page 81 for a reconciliation
to the most directly comparable GAAP nancial measure.