Freeport-McMoRan 2013 Annual Report Download - page 8
Download and view the complete annual report
Please find page 8 of the 2013 Freeport-McMoRan annual report below. You can navigate through the pages in the report by either clicking on the pages listed below, or by using the keyword search tool below to find specific information within the annual report.-
 1
1 -
 2
2 -
 3
3 -
 4
4 -
 5
5 -
 6
6 -
 7
7 -
 8
8 -
 9
9 -
 10
10 -
 11
11 -
 12
12 -
 13
13 -
 14
14 -
 15
15 -
 16
16 -
 17
17 -
 18
18 -
 19
19 -
20
-
21
-
22
-
23
-
24
-
25
-
26
-
27
-
28
-
29
-
30
-
31
-
32
-
33
-
34
-
35
-
36
-
37
-
38
-
39
-
40
-
41
-
42
-
43
-
44
-
45
-
46
-
47
-
48
-
49
-
50
-
51
-
52
-
53
-
54
-
55
-
56
-
57
-
58
-
59
-
60
-
61
-
62
-
63
-
64
-
65
-
66
-
67
-
68
-
69
-
70
-
71
-
72
-
73
-
74
-
75
-
76
-
77
-
78
-
79
-
80
-
81
-
82
-
83
-
84
-
85
-
86
-
87
-
88
-
89
-
90
-
91
-
92
-
93
-
94
-
95
-
96
-
97
-
98
-
99
-
100
-
101
-
102
-
103
-
104
-
105
-
106
-
107
-
108
-
109
-
110
-
111
-
112
-
113
-
114
-
115
-
116
-
117
-
118
-
119
-
120
-
121
-
122
-
123
-
124
-
125
-
126
-
127
-
128
-
129
-
130
-
131
-
132
-
133
-
134
-
135
-
136
-
137
-
138
 |
 |

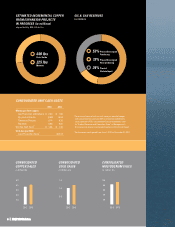
2012 2013
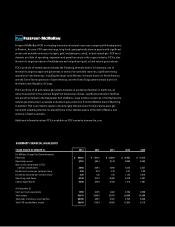
Mining (per lb of copper)
Site Production and Delivery $ 2.00 $ 1.88
By-product Credits (0.69) (0.57)
Treatment Charges 0.14 0.15
Royalties 0.03 0.03
Unit Net Cash Costs* $ 1.48 $ 1.49
Oil & Gas (per BOE)
Cash Production Costs* $17.14†
CONSOLIDATED UNIT CASH COSTS
CONSOLIDATED
COPPER SALES
in billion lbs
1.0
5.0
4.0
2.0
3.0
2012 2013
CONSOLIDATED
GOLD SALES
in million ozs
0.5
1.5
1.0
2012 2013
ESTIMATED INCREMENTAL COPPER
FROM EXPANSION PROJECTS
IN PROGRESS (in millions)
approximately 825 million lbs
600 lbs
Cerro Verde
225 lbs
Morenci
OIL & GAS RESERVES
464 MMBOE
5 3% Proved Developed
Producing
13% Proved Developed
Non-producing
34% Proved
Undeveloped
2012 2013
CONSOLIDATED
MOLYBDENUM SALES
in million lbs
20
40
100
60
80
* For a reconciliation of unit net cash costs per pound of copper
and cash production costs per BOE to production and delivery
costs reported in FCX’s consolidated financial statements, refer
to “Product Revenues and Production Costs” in Management’s
Discussion and Analysis contained elsewhere in this Annual Report.
† For the seven-month period from June 1, 2013, to December 31, 2013.
6 | FREEPORT-McMoRan