Freeport-McMoRan 2013 Annual Report Download - page 18
Download and view the complete annual report
Please find page 18 of the 2013 Freeport-McMoRan annual report below. You can navigate through the pages in the report by either clicking on the pages listed below, or by using the keyword search tool below to find specific information within the annual report.-
 1
1 -
2
-
3
-
4
-
5
-
6
-
7
-
 8
8 -
 9
9 -
 10
10 -
 11
11 -
 12
12 -
 13
13 -
 14
14 -
 15
15 -
 16
16 -
 17
17 -
 18
18 -
 19
19 -
 20
20 -
 21
21 -
 22
22 -
 23
23 -
 24
24 -
 25
25 -
 26
26 -
 27
27 -
 28
28 -
29
-
30
-
31
-
32
-
33
-
34
-
35
-
36
-
37
-
38
-
39
-
40
-
41
-
42
-
43
-
44
-
45
-
46
-
47
-
48
-
49
-
50
-
51
-
52
-
53
-
54
-
55
-
56
-
57
-
58
-
59
-
60
-
61
-
62
-
63
-
64
-
65
-
66
-
67
-
68
-
69
-
70
-
71
-
72
-
73
-
74
-
75
-
76
-
77
-
78
-
79
-
80
-
81
-
82
-
83
-
84
-
85
-
86
-
87
-
88
-
89
-
90
-
91
-
92
-
93
-
94
-
95
-
96
-
97
-
98
-
99
-
100
-
101
-
102
-
103
-
104
-
105
-
106
-
107
-
108
-
109
-
110
-
111
-
112
-
113
-
114
-
115
-
116
-
117
-
118
-
119
-
120
-
121
-
122
-
123
-
124
-
125
-
126
-
127
-
128
-
129
-
130
-
131
-
132
-
133
-
134
-
135
-
136
-
137
-
138
 |
 |

The addition of oil
and gas assets,
including major
production facilities
in the Deepwater
Gulf of Mexico, have
strengthened our
position as a leading
international natural
resources company.
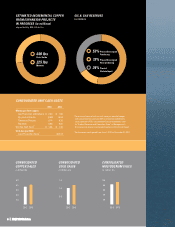
OIL & GAS SALES
in MMBOE
10
20
70
60
50
30
40
2013
†2014e
EAGLE HAYNESVILLE/ GULF OF
CALIFORNIA FORD MADDEN/OTHER MEXICO CONSOLIDATED
OPERATING MARGIN
Realized Revenue per BOE* $ 93.95 $ 78.87 $ 22.47 $ 84.00 $ 76.87
Cash Production Costs per BOE* 32.33 11.97 11.46 13.94 17.14
Cash Operating Margin per BOE $ 61.62 $ 66.90 $ 11.01 $ 70.06 $ 59.73
OIL & GAS MARGINS BY REGION†
Note: e = estimate.
† For the seven-month period from June 1, 2013, to December 31, 2013.
* For a reconciliation of realized revenues and cash production costs per BOE to revenues and production and delivery
costs reported in FCX’s consolidated financial statements, refer to “Product Revenues and Production Costs” in
Management’s Discussion and Analysis contained elsewhere in this Annual Report.
16 | FREEPORT-McMoRan