Federal Express 2000 Annual Report Download - page 11
Download and view the complete annual report
Please find page 11 of the 2000 Federal Express annual report below. You can navigate through the pages in the report by either clicking on the pages listed below, or by using the keyword search tool below to find specific information within the annual report.-
 1
1 -
 2
2 -
 3
3 -
 4
4 -
 5
5 -
 6
6 -
 7
7 -
 8
8 -
 9
9 -
 10
10 -
 11
11 -
 12
12 -
 13
13 -
 14
14 -
 15
15 -
 16
16 -
 17
17 -
 18
18 -
 19
19 -
 20
20 -
 21
21 -
 22
22 -
23
-
24
-
25
-
26
-
27
-
28
-
29
-
30
-
31
-
32
-
33
-
34
-
35
-
36
-
37
-
38
-
39
-
40
 |
 |

FedEx
Corp.
9
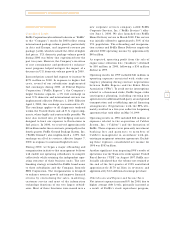
Revenues
In 2000, total package revenue for FedEx Express
increased 8%, principally due to increases in
international package volume and yield. List price
increases, including an average 2.8% dom estic
rate increase in March 1999, the fuel surcharges
im plemented in the second half of the year, an ongo-
ing yield m anagement program and a slight increase
in average weight per package, all contributed to
the increases in yields in 2000. While growth in
U.S. domestic package volum e was lower than
anticipated, the higher-yielding IP services experi-
enced strong growth, particularly in Asia and Europe.
Total freight revenue increased in 2000 due to
higher average daily pounds and improved yields in
U.S. freight, offset by declines in international
freight pounds.
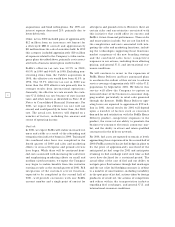
In 1999, FedEx Express experienced increased vol-
um e and slightly improved yields in its U.S.
overnight, U.S. deferred and IP services. Growth
in higher-priced U.S. overnight and IP services
FedEx Express
The following table com pares revenues and operating income (in millions) and selected statistics (in thou-
sands, except dollar am ounts) for the years ended May 31:
Percent Change
2000 1999 1998 2000/1999 1999/1998
Revenues:
Package:
U.S. overnight $ 7,538 $ 7,185 $ 6,810 +5 +6
U.S. deferred 2,428 2,271 2,179 +7 +4
International Priority (IP) 3,552 3,019 2,731 +18 +11
Total package revenue 13,518 12,475 11,720 +8 +6
Freight:
U.S. 566 440 337 +29 + 30
International 492 531 598 –7 –11
Total freight revenue 1,058 971 935 +9 +4
Other 492 533 600 –8 –11
Total revenues $15,068 $13,979 $13,255 +8 +5
Operating incom e $ 900 $ 871 $ 837 +3 +4
Package:
Average daily packages:
U.S. overnight 2,020 1,957 1,886 +3 +4
U.S. deferred 916 894 872 +3 +3
IP 319 282 259 +13 +9
Total packages 3,255 3,133 3,017 +4 +4
Revenue per package (yield):
U.S. overnight $ 14.52 $ 14.34 $ 14.22 +1 +1
U.S. deferred 10.31 9.93 9.84 +4 +1
IP 43.36 41.87 41.45 +4 +1
Com posite 16.16 15.56 15.30 +4 +2
Freight:
Average daily pounds:
U.S. 4,693 4,332 3,356 +8 +29
International 2,420 2,633 2,770 –8 – 5
Total freight 7,113 6,965 6,126 +2 +14
Revenue per pound (yield):
U.S. $ .47 $ .40 $ .40 +18 –
International .79 .79 .85 –– 7
Com posite .58 .54 .60 +7 –10