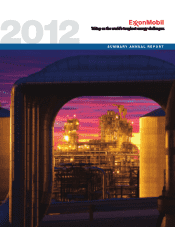
Exxon 2012 Annual Report Download - page 6
Download and view the complete annual report
Please find page 6 of the 2012 Exxon annual report below. You can navigate through the pages in the report by either clicking on the pages listed below, or by using the keyword search tool below to find specific information within the annual report.-
 1
1 -
 2
2 -
 3
3 -
 4
4 -
 5
5 -
 6
6 -
 7
7 -
 8
8 -
 9
9 -
 10
10 -
 11
11 -
 12
12 -
 13
13 -
 14
14 -
 15
15 -
 16
16 -
 17
17 -
18
-
19
-
20
-
21
-
22
-
23
-
24
-
25
-
26
-
27
-
28
-
29
-
30
-
31
-
32
-
33
-
34
-
35
-
36
-
37
-
38
-
39
-
40
-
41
-
42
-
43
-
44
-
45
-
46
-
47
-
48
-
49
-
50
-
51
-
52
 |
 |

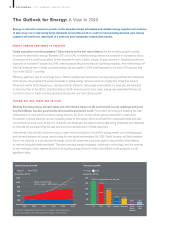
2012: Financial & Operating Results
Our competitive advantages formed the framework for solid financial and operating results across all key
measures and businesses in 2012. We achieved strong earnings and generated robust returns for our shareholders.
We also continued to invest in attractive opportunities that position the company for sustained long-term growth
and profitability.
RESULTS & HIGHLIGHTS
Strong safety and operations performance supported by effective risk management
Earnings of $45 billion and an industry-leading return on average capital employed of 25 percent
Total shareholder distributions of $30 billion
(1)
Dividends per share increased 21 percent in the second quarter of 2012, the 30th consecutive year
of dividend per share increases
Proved oil and gas reserves additions of 1.8 billion oil-equivalent barrels, replacing more
than 100 percent of production for the 19th consecutive year
Progressed Strategic Cooperation Agreement with Rosneft
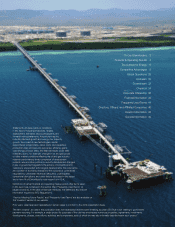
Started up three major Upstream liquids projects in West Africa with capacity of 350 thousand gross
barrels of oil per day
Completed construction and began commissioning activities of the Kearl Initial Development
project (top left) and the Singapore Chemical Expansion project (top right)
Eric Whetstone • Whetstone Design
ofce: 214-583-6118 • cell:
EDITOR
Todd Sepulveda • Investor Relations
Exxon Mobil Corporation, Irving, TX
ofce: 972-444-1151 • cell:504-312-0126
Carol Zuber-Mallison • ZM Graphics, Inc.
studio/cell: 214-906-4162 • fax: 817-924-7784
Usage: Exclusive rights within ExxonMobil
(c) 2013, ZM Graphics, Inc. Image can not be resold
ATTENTION: OWNER
Data list is used to drive the black and
template for the color chart. Bars and
lines are cut and pasted from the black
and white template and are highly
accurate. However, the color chart is
NOT linked to the database and is NOT
“driven” by the data; it is a piece of
artwork buiilt by a human. Therefore, the
editor needs to thoroughly proof the nal
artwork, not JUST the data list.
VERSION
APPROVED BY
Feb. 20, 2013
FILE INFO
LAST FILE CHANGE MADE BY
S04A 12XOMSAR-
FuncEarnings.ai
IN F&O ON PAGE
IN SAR ON PAGE
Note:
S 04A
F 02A
Includes link le
IS IN
SAR and F&O
in separate les
due to footnote page #s
2008 2009 2010 2011 2012
Functional Earnings and Net Income(2)
(billions of dollars)
50
40
30
20
10
0
Upstream Downstream Chemical Corporate
and Financing
Net
Income(3)
–3
(1) See Frequently Used Terms on pages 44 through 45.
(2) Earnings after income taxes including special items (2008 and 2009).
(3) Net income attributable to ExxonMobil.
(4) Royal Dutch Shell, BP, and Chevron values are on a consistent basis with ExxonMobil, based on public information.
35
30
25
20
15
10
5
ExxonMobil
(percent)
Integrated Oil Competitor Average(4)
2008 2009 2010 2011 2012
Return on Average Capital Employed(1)
Eric Whetstone • Whetstone Design
ofce: 214-583-6118 • cell:
EDITOR
Todd Sepulveda • Investor Relations
Exxon Mobil Corporation, Irving, TX
ofce: 972-444-1151 • cell:504-312-0126
Carol Zuber-Mallison • ZM Graphics, Inc.
studio/cell: 214-906-4162 • fax: 817-924-7784
ATTENTION: OWNER VERSION
APPROVED BY
Feb. 20, 2013
FILE INFO
LAST FILE CHANGE MADE BY
F02B S04B 12XOM
RoceLdrshp.ai
IN F&O ON PAGE
IN SAR ON PAGE
Note:
Includes link le
IS IN
SAR and F&O
EXXONMOBIL 2012 SUMMARY ANNUAL REPORT
4