Exxon 2008 Annual Report Download - page 17
Download and view the complete annual report
Please find page 17 of the 2008 Exxon annual report below. You can navigate through the pages in the report by either clicking on the pages listed below, or by using the keyword search tool below to find specific information within the annual report.-
 1
1 -
2
-
3
-
4
-
5
-
6
-
 7
7 -
 8
8 -
 9
9 -
 10
10 -
 11
11 -
 12
12 -
 13
13 -
 14
14 -
 15
15 -
 16
16 -
 17
17 -
 18
18 -
 19
19 -
 20
20 -
 21
21 -
 22
22 -
 23
23 -
 24
24 -
 25
25 -
 26
26 -
 27
27 -
28
-
29
-
30
-
31
-
32
-
33
-
34
-
35
-
36
-
37
-
38
-
39
-
40
-
41
-
42
-
43
-
44
-
45
-
46
-
47
-
48
-
49
-
50
-
51
-
52
 |
 |

EricWhetstone•WhetstoneDesignLab
office:214-788-6336•cell:
EDITOR
DavidBailey•InvestorRelations
ExxonMobilCorporation,Irving,TX
office:972-444-1135•cell:214-478-9189
CarolZuber-Mallison•ZMGraphics
studio/cell:214-906-4162•fax:817-924-7784
Usage:ExclusiverightswithinExxonMobil
(c)2009,ZMGraphicsImagecannotberesold
ATTENTION:OWNER
Datalistisusedtodrivetheblackand
templateforthecolorchart.Barsand
linesarecutandpastedfromtheblack
andwhitetemplateandarehighly
accurate.However,thecolorchartis
NOTlinkedtothedatabaseandisNOT
“driven”bythedata;itisapieceof
artworkbuiiltbyahuman.Therefore,the
editorneedstothoroughlyproofthefinal
artwork,notJUSTthedatalist.
VERSION
APPROVEDBY
Feb.19,2009
FILEINFO
LASTFILECHANGEMADEBY
21A08XOMF-
DemandByFuel.ai
Carol James Bill
INF&OONPAGE
INSARONPAGE
Note:
Includeslinkfile
ISIN
SARandF&O
200
150
100
50
GainWind,Solar&BiofuelsHydro/GeoBiomass/OtherNuclearCoalGasOil
Oil 83265 104932
Gas 48847 76679
Coal 54913 63731
Nuclear 14011 24936
Biomass/Other 21880 23677
Hydro/Geo 5768 9949
Wind,Solar&Biofuels 713 6541
Gain 0 169373
DatainKBDOE
0.9%
Annual
Growth
0.6%
1.8%
0.3%
2.3%
2.2% 9.3%
2030 Demand2005 Demand
EnergySource
GasOil Coal Nuclear Hydro,
Geo
Biomass,
Other Wind,
Solar,and
Biofuels
EnergySource:
EnergySavings
Due to Efficiencies
GrowthinGlobalEnergyDemand
(millions of oil-equivalent barrels per day)
AnnualGrowth
2005–2030
Average 1.2%
EricWhetstone•WhetstoneDesignLab
office:214-788-6336•cell:
EDITOR
DavidBailey•InvestorRelations
ExxonMobilCorporation,Irving,TX
office:972-444-1135•cell:214-478-9189
CarolZuber-Mallison•ZMGraphics
studio/cell:214-906-4162•fax:817-924-7784
Usage:ExclusiverightswithinExxonMobil
(c)2009,ZMGraphicsImagecannotberesold
ATTENTION:OWNER
Datalistisusedtodrivetheblackand
templateforthecolorchart.Barsand
linesarecutandpastedfromtheblack
andwhitetemplateandarehighly
accurate.However,thecolorchartis
NOTlinkedtothedatabaseandisNOT
“driven”bythedata;itisapieceof
artworkbuiiltbyahuman.Therefore,the
editorneedstothoroughlyproofthefinal
artwork,notJUSTthedatalist.
VERSION
APPROVEDBY
Feb.19,2009
FILEINFO
LASTFILECHANGEMADEBY
21BCD08XOMF-
CO2ByRegion.ai
Carol James Bill
INF&OONPAGE
INSARONPAGE
Note:
21BCD
S15B
Includeslinkfile
Alldatashowninmillionmetrictons
EuropeanUnion China
1980 2005 2030
Energy-RelatedCO2OutlookbyRegion
(billions of metric tons of CO2 per year)
10
8
6
4
2
United States European Union China
1980 2005 2030 1980 2005 2030
AnnualGrowth
2005–2030
Average –0.6%
AnnualGrowth
2005–2030
Average –0.6%
AnnualGrowth
2005–2030
Average 2.1%
ISIN
SARandF&O
This demand will be met by a wide variety of sources.
Conventional non-OPEC crude and condensate production
is expected to remain relatively flat through 2030. However,
growth is expected from a number of supply sources,
including oil sands, natural gas liquids, and biofuels, as
well as crude oil from OPEC countries. While the world’s
resource base is sufficient to meet projected demand,
access to resources and timely investments will remain
critical to meeting global needs.
LNG Import Market Will Grow
Increases in natural gas demand in major markets will
require new sources of supply. Unconventional natural gas
resources (e.g., tight gas, shale gas, coalbed methane) will
contribute more significantly to supplies over time, enabled
by technology advances. In addition new technologies
are spurring development of a global market for liquefied
natural gas (LNG), which is expected to more than triple in
volume from 2005 to 2030 and help meet growing demand
in North America, Europe, and Asia Pacific.
Global Energy in Perspective
Viewed globally, it is clear that the world’s energy mix is
highly diverse. Today, oil, natural gas, and coal provide
approximately 80 percent of world energy. By 2030, oil
will remain the largest source of energy supply at close to
35 percent. Natural gas will grow the fastest of the fossil
fuels and will overtake coal as the second-largest energy
source. Nuclear power will increase significantly, surpassing
coal in terms of absolute growth and becoming the fourth-
largest fuel source. Hydro and geothermal will also grow,
but they are limited by the availability of natural sites. Wind,
solar, and biofuels will increase about 9 percent per year on
average, the highest growth rate of all fuels.
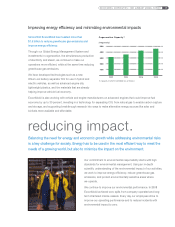
In developing this Outlook, we assume significant efficiency
improvements over time. Compared to 2005 energy-intensity
levels, these improvements translate to energy savings of
approximately 170 million oil-equivalent barrels per day by
2030 – about double the corresponding growth in demand.
Achieving these gains will be critical to helping meet global
energy challenges.
Growing Energy Demand and CO2 Emissions
The outlook for energy-related CO
2
emissions is linked
directly to projections of the amount and type of energy
required. Looking globally we do not expect CO
2
emissions
to peak by 2030. While the United States and other
developed countries will reduce emissions, the economic
growth and associated energy needs of developing
countries will drive global CO
2
levels higher. This highlights
the challenge ahead for the world – how to continue to
provide the energy necessary to bring billions of people
up the economic ladder while mitigating the growth of
CO
2
emissions.
Conclusion
This Outlook makes clear that the world’s energy challenges
are formidable. We believe that meeting these global energy
challenges requires an integrated set of solutions that includes:
• Moderating demand through new technologies that improve
energy efficiency in our vehicles, homes, and businesses.
• Expanding access to all economically viable energy
sources – oil, natural gas, coal, nuclear, and alternative
and renewable sources such as wind, solar, and biofuels.
• Mitigating the risks of climate change through technologies
that advance energy efficiency, enable widespread use of
renewables, and capture and store CO
2
emissions.
Looking to 2030 and beyond, we realize that the scale of our
global challenge is enormous, but so, too, is our commitment
to succeed and our capacity to innovate. ExxonMobil is
confident that by pursuing this integrated set of solutions –
while working with governments to create reliable policy and
investment environments for these solutions to thrive – the
world can achieve both energy and environmental security to
support growing economic prosperity.
E X X O N M O B I L C O R P O R A T I O N • 2 0 0 8 S U M M A R Y A N N U A L R E P O R T 15