Express 2011 Annual Report Download - page 16
Download and view the complete annual report
Please find page 16 of the 2011 Express annual report below. You can navigate through the pages in the report by either clicking on the pages listed below, or by using the keyword search tool below to find specific information within the annual report.world, primarily in Asia and Central and South America. Our top 10 manufacturers, based on cost, supplied
approximately 30% of our merchandise in 2011. Mast assisted us with the purchase of $449.2 million, $430.0
million, and $480.7 million of our goods in 2011, 2010, and 2009, respectively, representing 54%, 58%, and 68%
of total goods purchased during those periods. Approximately 92% to 96% of the amounts paid to Mast consist of
pass through costs for products sourced from manufacturers with whom we have a direct relationship. The
remainder of the amounts paid to Mast relate to fees charged to us in Mast’s capacity as a buying agent. Our unit
volumes, long-established vendor relationships, and knowledge of fabric and production costs, combined with a
flexible, diversified sourcing base, enable us to buy high-quality, low cost goods. We source from approximately
25 countries. We purchase our merchandise using purchase orders and, therefore, are not subject to long-term
production contracts with any of our vendors, manufacturers, or buying agents.
Quality Assurance and Compliance Monitoring
We conduct extensive post-season reviews of our products to identify areas in which our merchandising process
can be improved. We believe that each of the components of our merchandising model helps us to maximize our
sales and margins and reduce our inventory risk. Regardless of the sourcing method used, each factory,
subcontractor, supplier, and agent that manufactures our merchandise is required to adhere to our Code of
Vendor Conduct. This is designed to ensure that each of our suppliers’ operations are conducted in a legal,
ethical, and responsible manner. Our Code of Vendor Conduct requires that each of our suppliers operates in
compliance with applicable wage, benefit, working hours, and other local laws. It also forbids the use of practices
such as child labor or forced labor. We monitor compliance through the use of third parties who conduct regular
factory audits.
Distribution
We centrally distribute finished products from third-party distribution centers in Columbus and Groveport, Ohio.
The Columbus facility is approximately 381,000 square feet and is operated under a long-term logistics services
agreement with an affiliate of Limited Brands. Virtually all of our merchandise is received, processed,
warehoused, and distributed through the Columbus distribution facility. Merchandise is typically shipped to our
stores and to the Groveport distribution facility via third-party delivery services multiple times per week,
providing them with a steady flow of new inventory.
The third-party distribution facility in Groveport is used to fulfill all orders placed through our website. This
facility is owned and operated by an affiliate of Golden Gate. Merchandise at this facility is received from our
Columbus distribution facility and sent directly to customers via third-party delivery services. We believe that
this distribution center’s proximity to our home office in Columbus provides several benefits, including faster
replenishment of out-of-stock inventory, more efficient trucking lanes to our customers, reduced delivery costs,
and ease of oversight and management of our third party provider.
For additional information on our third-party distribution relationships, see Note 7 to our Consolidated Financial
Statements.
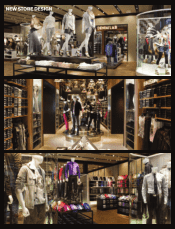
Our Stores
As of January 28, 2012, we operated 609 stores in 47 states across the United States, as well as in the District of
Columbia, Puerto Rico, and 2 provinces in Canada. These include 576 dual-gender stores, 20 women’s stores,
and 13 men’s stores.
Our average retail store is approximately 8,700 gross square feet and generates approximately $3.0 million per
year in sales. The first table below indicates certain historical information regarding the number of stores by type
of location, total gross square footage (which includes retail selling, storage, and back-office space) of all stores,
and average gross square footage of our stores as of the end of the fiscal year indicated. The second table below
8


