Eversource 2004 Annual Report Download - page 3
Download and view the complete annual report
Please find page 3 of the 2004 Eversource annual report below. You can navigate through the pages in the report by either clicking on the pages listed below, or by using the keyword search tool below to find specific information within the annual report.-
 1
1 -
 2
2 -
 3
3 -
 4
4 -
 5
5 -
 6
6 -
 7
7 -
 8
8 -
 9
9 -
 10
10 -
 11
11 -
 12
12 -
 13
13 -
 14
14 -
15
-
16
-
17
-
18
-
19
-
20
-
21
-
22
-
23
-
24
-
25
-
26
-
27
-
28
-
29
-
30
-
31
-
32
-
33
-
34
-
35
-
36
-
37
-
38
-
39
-
40
-
41
-
42
-
43
-
44
-
45
-
46
-
47
-
48
-
49
-
50
-
51
-
52
-
53
-
54
-
55
-
56
-
57
-
58
-
59
-
60
-
61
-
62
-
63
-
64
-
65
-
66
-
67
-
68
-
69
-
70
-
71
-
72
-
73
-
74
-
75
-
76
-
77
-
78
-
79
-
80
-
81
-
82
-
83
-
84
-
85
-
86
-
87
-
88
-
89
-
90
-
91
-
92
 |
 |

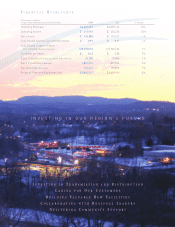
FINANCIAL HIGHLIGHTS
(Thousands of dollars,
except share information and statistical data) 2004 2003 % Change
Operating Revenues $6,686,699 $6,069,156 10%
Operating Income $412,952 $424,236 (3)%
Net Income $ 116,588 $116,411 —%
Fully Diluted Earnings per Common Share $0.91 $0.91 —%
Fully Diluted Common Shares
Outstanding (Weighted Average) 128,396,076 127,240,724 1%
Dividends per Share $0.63 $0.58 9%
Sales of Electricity (Regulated Retail, kWh-millions) 36,198 35,866 1%
Electric Customers (Average) 1,865,334 1,829,876 2%
Gas Customers (Average) 194,212 192,816 1%
Property, Plant and Equipment, Net $5,864,161 $5,429,916 8%
INVESTING IN TRANSMISSION AND DISTRIBUTION
CARINGFOR OUR CUSTOMERS
BUILDINGVALUABLE NE W FACILITIES
COLLABORATING WITH REGIONAL LEADERS
DELIVERINGCOMMUNITYSUPPOR T
INVESTING IN OUR REGION’S FUTURE