Eversource 2003 Annual Report Download - page 2
Download and view the complete annual report
Please find page 2 of the 2003 Eversource annual report below. You can navigate through the pages in the report by either clicking on the pages listed below, or by using the keyword search tool below to find specific information within the annual report.-
 1
1 -
 2
2 -
 3
3 -
 4
4 -
 5
5 -
 6
6 -
 7
7 -
 8
8 -
 9
9 -
 10
10 -
 11
11 -
 12
12 -
 13
13 -
14
-
15
-
16
-
17
-
18
-
19
-
20
-
21
-
22
-
23
-
24
-
25
-
26
-
27
-
28
-
29
-
30
-
31
-
32
-
33
-
34
-
35
-
36
-
37
-
38
-
39
-
40
-
41
-
42
-
43
-
44
-
45
-
46
-
47
-
48
-
49
-
50
-
51
-
52
-
53
-
54
-
55
-
56
-
57
-
58
-
59
-
60
-
61
-
62
-
63
-
64
-
65
-
66
-
67
-
68
-
69
-
70
-
71
-
72
-
73
-
74
-
75
-
76
-
77
-
78
-
79
-
80
-
81
-
82
-
83
-
84
-
85
 |
 |

Company Profile
Northeast Utilities (NYSE: NU) is a Fortune 500 diversified energy company located in Connecticut with operations
throughout the Northeast. Through its competitive and regulated subsidiaries, NU provides a full range of energy
products and services to millions of residential and business customers from Maine to Maryland. From delivering
electricity and natural gas, to marketing energy commodities, to operating and maintaining power plant facilities,
NU is committed to safety, reliability and expanding consumers’ energy options. For more information on Northeast
Utilities and its subsidiaries, visit the NU family of Web sites at www.nu.com.
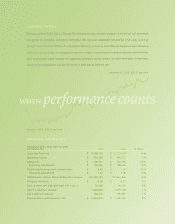
financial highlights
(Thousands of dollars, except share information
and statistical data) 2003 2002 % Change
Operating Revenues $ 6,069,156 $5,237,000 16%
Operating Income $ 433,366 $ 466,655 (7)%
Net Income $ 116,411 $ 152,109 (23)%
Excluding Adjustments $ 158,065 $ 138,609 14%
Fully Diluted Earnings Per Common Share $ 0.91 $1.18 (23)%
Excluding Adjustments $ 1.24 $ 1.08 15%
Fully Diluted Common Shares Outstanding (Average) 127,240,724 129,341,360 (2)%
Dividends Per Share $ 0.58 $0.53 9%
Sales of Electricity (Regulated Retail, kWh-millions) 35,866 34,634 4%
Electric Customers (Average) 1,829,876 1,809,528 1%
Gas Customers (Average) 192,816 190,855 1%
Property, Plant and Equipment, Net $ 5,429,916 $5,049,369 8%
When performance counts
January 1, 2003 $15.17 per share
December 31, 2003 $20.17 per share