Equifax 2000 Annual Report Download - page 14
Download and view the complete annual report
Please find page 14 of the 2000 Equifax annual report below. You can navigate through the pages in the report by either clicking on the pages listed below, or by using the keyword search tool below to find specific information within the annual report.-
 1
1 -
2
-
3
-
 4
4 -
 5
5 -
 6
6 -
 7
7 -
 8
8 -
 9
9 -
 10
10 -
 11
11 -
 12
12 -
 13
13 -
 14
14 -
 15
15 -
 16
16 -
 17
17 -
 18
18 -
 19
19 -
 20
20 -
 21
21 -
 22
22 -
 23
23 -
 24
24 -
25
-
26
-
27
-
28
-
29
-
30
-
31
-
32
-
33
-
34
-
35
-
36
-
37
-
38
-
39
-
40
-
41
-
42
-
43
-
44
-
45
-
46
-
47
-
48
-
49
-
50
-
51
-
52
-
53
 |
 |

During 1999 and 1998, expense amounting to
$26.4 million and $24.2 million, respectively,
was incurred in connection with assessment,
remediation planning, remediation, testing
and contingency planning activities for applica-
tion software and host environments of the
Company’s information technology systems
associated with preparation for year 2000.
Minimal costs were incurred during 2000 as
the Company did not experience any discern-
able interruptions related to this matter.
Approximately half of this annual cost was
from internal resources that have been rede-
ployed to manage ongoing system maintenance
and development throughout the Company.
Other Income, Net
Other income includes interest income of
$9.2 million in 2000, $6.5 million in 1999 and
$4.8 million in 1998.
During 2000, sales of the Divested Operations
and the sale of an investment in a card process-
ing operation in India resulted in a net pretax
loss of $2.0 million. In 1999, the Company sold
its investment in Proceda S.A. in Brazil and
three risk management offices located in the
U.S. that resulted in a $7.1 million pretax gain.
These amounts were recorded in other income.
Interest Expense
Interest expense increased $15 million in
2000 and $18.3 million in 1999 as compared
with prior years. The increase in both years
resulted from higher average debt outstanding
associated with acquisition activity in 2000
and 1998 and treasury stock purchases in 1999
and 1998. Average total debt outstanding was
$1,101.3 million in 2000, $975.8 million in 1999
and $633.9 million in 1998.
Effective Tax Rate
The effective tax rates were 40.8%, 41.0% and
40.9% in 2000, 1999 and 1998, respectively. The
effective rate in 2001 is expected to decline to
approximately 40.5%, due to the effects of tax
planning strategies and a higher level of for-
eign earnings in lower tax rate jurisdictions.
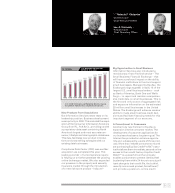
Net Income and Diluted
Earnings per Share
The percentage growth in diluted earnings
per share of 8.4% in 2000 and 15.7% in 1999
exceeded the comparable growth rates in
net income of 5.6% and 11.6%, respectively,
due to the accretive effects of treasury stock
purchases in 1999 and 1998. Average diluted
shares outstanding were 136.0 million in 2000,
139.6 million in 1999 and 144.4 million in 1998.
Segment Results
The following table summarizes the segment
results for each of the three years ended
December 31, 2000. The results of businesses
sold in the fourth quarter of 2000, which
include the Company’s risk management busi-
nesses located in the U.S., Canada, and the
U.K., as well as the vehicle information busi-
ness in the U.K., have been classified as
Divested Operations. Prior year information
has been restated to conform to the current
year presentation.
13