Equifax 2000 Annual Report Download - page 13
Download and view the complete annual report
Please find page 13 of the 2000 Equifax annual report below. You can navigate through the pages in the report by either clicking on the pages listed below, or by using the keyword search tool below to find specific information within the annual report.-
 1
1 -
2
-
 3
3 -
 4
4 -
 5
5 -
 6
6 -
 7
7 -
 8
8 -
 9
9 -
 10
10 -
 11
11 -
 12
12 -
 13
13 -
 14
14 -
 15
15 -
 16
16 -
 17
17 -
 18
18 -
 19
19 -
 20
20 -
 21
21 -
 22
22 -
 23
23 -
24
-
25
-
26
-
27
-
28
-
29
-
30
-
31
-
32
-
33
-
34
-
35
-
36
-
37
-
38
-
39
-
40
-
41
-
42
-
43
-
44
-
45
-
46
-
47
-
48
-
49
-
50
-
51
-
52
-
53
 |
 |

Overview
This discussion and analysis should be read in
conjunction with the consolidated financial
statements and accompanying notes. The fol-
lowing table summarizes the consolidated
results for each of the three years ended
December 31, 2000.
(millions, except per share amounts)
Year Ended December 31, 2000 1999 1998
Revenue $1,965.9 $1,772.7 $1,621.0
Operating income $ 455.4 $ 414.5 $ 365.7
Other income, net $ 5.9 $ 12.4 $ 4.3
Interest expense $ (76.0) $ (61.0) $ (42.7)
Net income $ 228.0 $ 215.9 $ 193.4
Diluted earnings per share $ 1.68 $ 1.55 $ 1.34
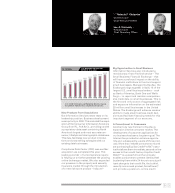
Revenue
Revenue in 2000 of $1.97 billion was an increase
of $193.2 million, or 10.9%, over 1999. Revenue
increased $151.7 million in 1999, 9.4% over 1998.
North American Information Services revenue
grew 6.3% in 2000, driven largely by an increase
in Marketing Services. Payment Services rev-
enue increased 14.2% in 2000 from growth in
both Check Solutions and Card Solutions.
The growth in 2000 revenue was also influ-
enced by the acquisition of Consumer
Information Services (“CIS”) on May 1, 2000,
the dispositions of the global risk manage-
ment businesses on October 1, 2000, and the
vehicle information business in the U.K. on
December 22, 2000 (“Divested Operations”),
and the effects of changes in foreign exchange
rates. CIS generated revenue of $110.5 million
during 2000. In total, the Divested Operations
generated revenue of $132.5 million prior to
disposition in 2000 compared with $175.0 mil-
lion for full year 1999. The strengthening of the
U.S. dollar against foreign currencies during
2000, particularly the British pound and Spanish
peseta, reduced 2000 revenue growth by approx-
imately $23 million as compared with 1999.
The increase in revenue during 1999 was
driven by growth in the U.S. Card and Check
operations as well as international acquisitions
in Equifax Europe, Equifax Latin America and
Card Solutions. The strengthening of the U.S.
dollar against foreign currencies during 1999,
particularly the Brazilian real, reduced 1999
revenue growth by approximately $36 million
as compared with 1998.
Operating Income
Operating income of $455.4 million in 2000
increased $40.9 million, or 9.9%, over 1999. In
1999, operating income increased $48.9 million,
or 13.4%, over 1998. Consolidated operating
margins were 23.2% in 2000, 23.4% in 1999
and 22.6% in 1998.
Increased operating income in 2000 and 1999
resulted from revenue growth as well as cost
reduction initiatives throughout the Company.
Cost reduction achievements in both years
included headcount reductions, the outsourcing
of certain administrative functions, improved
pricing from service providers in data processing
and telecommunications, and lower benefit costs.
MANAGEMENT’S DISCUSSION & ANALYSIS OF RESULTS
OF OPERATIONS & FINANCIAL CONDITION
12