Epson 2008 Annual Report Download - page 3
Download and view the complete annual report
Please find page 3 of the 2008 Epson annual report below. You can navigate through the pages in the report by either clicking on the pages listed below, or by using the keyword search tool below to find specific information within the annual report.-
 1
1 -
 2
2 -
 3
3 -
 4
4 -
 5
5 -
 6
6 -
 7
7 -
 8
8 -
 9
9 -
 10
10 -
 11
11 -
 12
12 -
 13
13 -
 14
14 -
15
-
16
-
17
-
18
-
19
-
20
-
21
-
22
-
23
-
24
-
25
-
26
-
27
-
28
-
29
-
30
-
31
-
32
-
33
-
34
-
35
-
36
-
37
-
38
-
39
-
40
-
41
-
42
-
43
-
44
 |
 |

2Seiko Epson Corporation
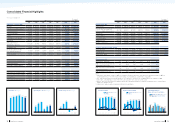
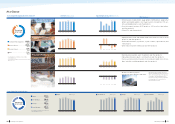
Consolidated Financial Highlights
Seiko Epson Corporation and Subsidiaries
3Annual Report 2008
Millions of yen
Thousands of
U.S. dollars
2003 2004 2005 2006 2007 2008 2008
Statements of income data
Net sales ¥1,322,453 ¥1,413,243 ¥1,479,750 ¥1,549,568 ¥1,416,032 ¥1,347,841 $13,452,853
Information-related equipment 915,857 920,380 946,029 976,443 916,330 902,970 9,012,583
Electronic devices 354,288 441,153 482,611 526,967 444,703 395,197 3,944,477
Precision products 79,745 81,102 81,143 85,778 87,744 83,927 837,680
Other 26,310 29,457 34,510 32,977 30,310 29,124 290,692
Eliminations and corporate (53,747) (58,849) (64,543) (72,597) (63,055) (63,378) (632,579)
Gross profit 362,588 399,284 409,739 354,787 356,773 368,449 3,677,508
Selling, general and
administrative expenses 313,228 321,883 318,772 329,029 306,430 310,871 3,102,822
Operating income 49,360 77,401 90,967 25,758 50,343 57,577 574,686
Income (loss) before income
taxes and minority interest 31,629 65,058 73,647 (20,047) 3,476 52,045 519,467
Net income (loss) 12,510 38,031 55,689 (17,917) (7,094) 19,093 190,574
Research and development costs 85,761 90,485 89,042 92,939 84,690 82,870 827,131
Capital expenditures 89,111 70,379 157,535 118,283 77,548 64,991 648,683
Depreciation and amortization 125,809 110,314 104,241 109,305 89,603 79,209 790,588
Cash flows from operating activities 159,504 182,669 162,489 117,497 160,229 112,060 1,118,478
Cash flows from investing activities (107,943) (65,329) (99,396) (95,266) (76,419) (50,770) (506,742)
Free cash flow 51,561 117,340 63,093 22,231 83,810 61,289 611,736
Cash flows from financing activities 9,111 (40,918) (96,373) 19,123 (30,150) (70,663) (705,292)
Millions of yen
Thousands of
U.S. dollars
2003 2004 2005 2006 2007 2008 2008
Balance sheet data
Current assets ¥ 645,310 ¥ 709,169 ¥ 746,712 ¥ 795,402 ¥ 813,274 ¥ 737,245 $ 7,358,469
Property, plant and equipment
(net of accumulated depreciation) 442,769 393,031 441,355 426,118 379,032 343,261 3,426,108
Total assets 1,196,080 1,206,491 1,297,790 1,325,206 1,284,412 1,139,165 11,370,047
Current liabilities 493,087 417,573 504,601 507,371 476,125 385,123 3,843,929
Long-term liabilities 419,069 372,009 293,662 311,610 313,952 282,595 2,820,595
Equity/net assets 281,316 414,367 472,870 474,520 494,335 471,446 4,705,522
Number of employees 73,797 84,899 85,647 90,701 87,626 88,925
Per share data (yen and U.S. dollars)
Net income (loss) ¥ 81.08 ¥ 204.70 ¥ 283.60 ¥ (91.24) ¥ (36.13) ¥ 97.24 $ 0.97
Cash dividends 18.00 18.00 22.00 29.00 32.00 32.00 0.32
Shareholders’ equity 1,851.13 2,110.20 2,408.13 2,416.54 2,395.14 2,277.45 22.73
Financial ratios (%)
Shareholders’ equity ratio 23.5 34.3 36.4 35.8 36.6 39.3
ROE <net income (loss)/average shareholders’
equity at beginning and end of year> 4.5 10.9 12.6 (3.8) (1.5) 4.2
ROA <pretax profit (loss)/average total assets
at beginning and end of year> 2.6 5.4 5.9 (1.5) 0.3 4.3
ROS <pretax profit (loss)/net sales> 2.4 4.6 5.0 (1.3) 0.2 3.9
Notes:
1. Amounts for periods prior to April 1, 2007, are rounded off. However, amounts for periods from or subsequent to April 1, 2007, are
rounded down. Please refer to the “Basis of presenting consolidated financial statements” on page 56.
2. U.S. dollar amounts have been translated from yen, for convenience only, at the rate of ¥100.19=U.S.$1 as of March 31, 2008.
3. In this table, cash dividends per share refers to the amount paid for each share in each fiscal year.
4. Refer to “Note 3 (15) Presentation of equity/net assets and consolidated statements of changes in equity/net assets” on page 59 for a
definition of equity/net assets.
5. Shareholders’ equity is equity excluding minority interest in subsidiaries.
2003 2004 2005 2006 2007 2008
Net Sales (Billions of yen)
1,322.5
1,413.2
1,479.8
1,549.6
1,416.0
1,347.8
2003 2004 2005 2006 2007 2008
Operating Income (Billions of yen)
49.4
77.4
91.0
25.8
50.3
57.5
2003 2004 2005 2006 2007 2008
Net Income (Loss) (Billions of yen)
19.0
12.5
38.0
55.7
-17.9 -7.1
2003 2004 2005 2006 2007 2008
Total Assets/ROA
Total assets (Billions of yen)
ROA (%)
1,196.1 1,206.5
1,297.8 1,325.2 1,284.4
2.6
5.4 5.9
-1.5
0.3
1,139.1
4.3
2003 2004 2005 2006 2007 2008
Capital Expenditures
Depreciation and Amortization
Capital expenditures (Billions of yen)
Depreciation and amortization
(Billions of yen)
89.1
70.4
157.5
118.3
77.5
125.8
110.3 104.2 109.3
89.6
64.9 79.2
2003 2004 2005 2006 2007 2008
Equity/Net Assets/ROE
Equity/net assets (Billions of yen)
ROE (%)
281.3
414.4
472.9 474.5 494.3
4.5
10.9
12.6
-3.8
-1.5
471.4
4.2
For the years ended March 31