Epson 2008 Annual Report Download - page 10
Download and view the complete annual report
Please find page 10 of the 2008 Epson annual report below. You can navigate through the pages in the report by either clicking on the pages listed below, or by using the keyword search tool below to find specific information within the annual report.-
 1
1 -
 2
2 -
 3
3 -
 4
4 -
 5
5 -
 6
6 -
 7
7 -
 8
8 -
 9
9 -
 10
10 -
 11
11 -
 12
12 -
 13
13 -
 14
14 -
 15
15 -
 16
16 -
 17
17 -
 18
18 -
 19
19 -
 20
20 -
 21
21 -
22
-
23
-
24
-
25
-
26
-
27
-
28
-
29
-
30
-
31
-
32
-
33
-
34
-
35
-
36
-
37
-
38
-
39
-
40
-
41
-
42
-
43
-
44
 |
 |

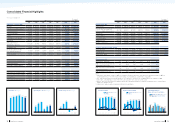
16 Seiko Epson Corporation 17Annual Report 2008
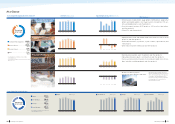
Information-Related Equipment 64.0 %
(
62.0%)
Electronic Devices 28.0 %
(
30.1%)
Precision Products 5.9 %
(
5.9%)
Other 2.1%
(
2.0%)
20072003 2004 2005 2008
902.9
915.9 920.4 946.0 916.3
976.4
2006
Percentage
of net sales 20072003 2004 2005 2008
83.2
80.4
45.9
61.6
84.2
45.0
2006
20072003 2004 2005 2008
395.1
354.3
441.2 482.6 444.7
527.0
2006 20072003 2004 2005 2008
-17.1
-28.0
40.6 38.6
-26.1
-9.8
2006
20072003 2004 2005 20082006 20072003 2004 2005 20082006
20072003 2004 2005 20082006 20072003 2004 2005 2008
-11.4
-3.7 -12.0 -13.0 -12.2-12.8
2006
* The proportion of consolidated net sales includes
inter-segment sales.
* Percentages in parentheses are for the fiscal year ended
March 31, 2007.
83.9
79.7 81.1 81.1 87.7
85.8
2.7
0.6
2.8 2.4
3.6
2.4
29.1
26.3 29.5
34.5 30.3
33.0
Japan The Americas Europe Asia / Oceania(Billions of yen)(Billions of yen) (Billions of yen) (Billions of yen)
20072003 2004 2005 2008
427.9
489.6 503.9
534.7
451.6
484.6
2006 20072003 2004 2005 2008
274.4
240.0 235.1
266.6 270.5
285.1
2006 20072003 2004 2005 2008
344.4
318.6
363.4
386.1
341.5
357.8
2006 20072003 2004 2005 2008
301.0
274.3
310.8 292.3
352.4
422.0
2006
Japan 31.8%
(31.9%)
The Americas 20.4%
(19.1%)
Europe 25.5%
(24.1%)
Asia / Oceania 22.3%
(24.9%)
Percentage
of net sales
* Percentages in parentheses are for the fiscal
year ended March 31, 2007.
Consolidated Net Sales by Business Segment*
(Year ended March 31, 2008)
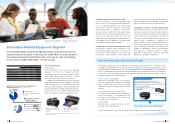
Information-Related
Equipment
Net Sales (Billions of yen)
For the years ended March 31
Operating Income (Loss) (Billions of yen)
For the years ended March 31 Main Businesses
• Printer business (inkjet printers, page printers, SIDM printers, large-format
printers and related supplies, color image scanners, mini-printers, POS sys-
tems and related products, and other products)
• Visual instruments business (3LCD projectors, LCD monitors, label writers,
and other products)
• Others (PCs and other products)
Electronic Devices • Display business (small- and medium-sized LCDs, HTPS TFT LCDs for 3LCD
projectors, and other products)
• Quartz device business (crystal units, crystal oscillators, optical devices, and
other products)
• Semiconductor business (CMOS LSIs and other products)
Precision Products • Watch business (watches, watch movements, and other products)
• Optical device business (plastic corrective lenses and other products)
• Factory automation products business (horizontally-articulated robots, IC han-
dlers, industrial-use inkjet equipment, and other products)
Other • Business incubation projects*
• Intra-Group service business and others
Epson Innovation Center
Consolidated Net Sales by Region
At a Glance
* Among its business incubation projects,
Epson is developing a variety of businesses
with commercial potential and is engaged
in a number of promising R&D projects.
Research into next-generation information-
related equipment is carried out at the
Epson Innovation Center.
epsonAR08e_0715_090608.indd 16-17epsonAR08e_0715_090608.indd 16-17 09.6.8 10:00:53 AM09.6.8 10:00:53 AM