Epson 2006 Annual Report Download - page 11
Download and view the complete annual report
Please find page 11 of the 2006 Epson annual report below. You can navigate through the pages in the report by either clicking on the pages listed below, or by using the keyword search tool below to find specific information within the annual report.-
 1
1 -
 2
2 -
 3
3 -
 4
4 -
 5
5 -
 6
6 -
 7
7 -
 8
8 -
 9
9 -
 10
10 -
 11
11 -
 12
12 -
 13
13 -
 14
14 -
 15
15 -
 16
16 -
 17
17 -
 18
18 -
 19
19 -
 20
20 -
 21
21 -
 22
22 -
23
-
24
-
25
-
26
-
27
-
28
-
29
-
30
-
31
-
32
-
33
-
34
-
35
-
36
-
37
-
38
-
39
-
40
-
41
-
42
-
43
-
44
-
45
-
46
-
47
-
48
-
49
-
50
-
51
-
52
-
53
-
54
-
55
-
56
-
57
-
58
-
59
-
60
-
61
-
62
-
63
-
64
-
65
-
66
-
67
-
68
-
69
-
70
-
71
-
72
-
73
-
74
-
75
-
76
-
77
-
78
 |
 |

Seiko Epson Annual Report 2006 9
Q4. Please elaborate on how Epson plans
to streamline costs.
One major reason for lackluster earnings was inadequate
capacity to curb costs in response to falling prices. We have long
taken steps to pare back costs, but these have essentially been
cancelled out by the impact of falling prices and other factors. If
we’re going to adequately respond to market changes and still
recover to strengthen our earnings capabilities, then we have to
raise the bar when it comes to cost reductions. In terms of pro-
curement costs, product design departments are working closely
with other sections to introduce a design-to-cost approach, and
are shifting to a cost-oriented mindset. Regarding logistics costs,
we are reviewing and optimizing product delivery routes and the
ordering system for production bases, including those of Group
companies. In addressing so-called quality costs, our efforts involve
striving to address quality issues at the production source and
introducing stringent measures to prevent the recurrence of qual-
ity issues. And as far as service support costs go, we remain
committed to steps to boost quality based on feedback from our
customers, as we work to enhance efficiency in the drive to reduce
costs. We’re also improving efficiency by moving forward with the
consolidation and integration of domestic production and staffing
bases. These measures are all being developed in conjunction with
detailed action plans in place at the business unit and divisional
level. Since the key to spurring definitive earnings growth is internal
diligence, the entire Epson Group is taking part in the push to en-
hance cost efficiency.
Q5. Why did reforming Epson’s governance
system require such a drastic reduction in the
number of directors?
Reforming our system of governance is vital to reaching the
goals of our mid-range business plan. We reduced the number
of directors by such a large number, from a previous maximum
of 25 to a maximum of 10, both to strengthen Epson’s
management framework and to facilitate ongoing reforms. This
move reflects our intent to forge a structure that better exem-
plifies the checks and balances crucial to sound management.
It brings greater speed to decision-making, while simulta-
neously encouraging more vigorous debate of issues by the
board of directors. The introduction of an executive officer
system has also enabled us to separate management
functions, dividing them among directors responsible for
decision-making and oversight, and executive officers
responsible for divisional operations. In parallel, we shortened
the term of office for directors from two years to one, so
directors can be better assessed each year on the results of
the missions they have been assigned. Another decision we
made was to abolish our system of retirement benefits for
directors and corporate auditors and adopting a remunera-
tion system for senior management pegged to Epson’s share
price. Aside from strengthening the commitment of directors
to reaching their targets, these changes create a stronger
connection between compensation packages and shareholder
value. Through this renewed dedication and common stake
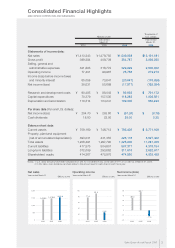
Fixed-Cost Restructuring—Details and Effect of Reductions*
* Figures based on forecasts made at the announcement of the mid-range business plan in March 2006.
(Billions of yen)
Extraordinary loss Effect of fixed-cost reductions
2006 2007 Total 2007 2008 2009 Total
Total restructuring charges in electronic devices
Site and line reorganization
One-time write-off of
technical acquisition cost
Subtotal
MD-TFD asset impairment
Production equipment
impairment/disposal
Subtotal
Line reorganization
Reduce contingent workforce by 3,000 over 3 years
IC
LCD
HTPS
Workforce
streamlining
Total
Other
(reduction in force in European area, etc.)
44.7 3.0 47.7 12.0 14.0 11.0 37.0
17.5 3.0 20.5
24.6 3.0 27.6
7.1 – 7.1 8.0 10.0 7.5 25.5
15.7 – 15.7
17.1 – 17.1
2.9 – 2.9
1.6 – 1.6
46.3 3.0 49.3
1.3 – 1.3 4.0 3.0 2.5 9.5
1.5
–1.01.02.0
1.5 1.5 4.5
2.5 7.5 12.5 22.5
16.0 23.0 25.0 64.0
(Years ending March 31)