Entergy 2014 Annual Report Download - page 11
Download and view the complete annual report
Please find page 11 of the 2014 Entergy annual report below. You can navigate through the pages in the report by either clicking on the pages listed below, or by using the keyword search tool below to find specific information within the annual report.-
 1
1 -
 2
2 -
 3
3 -
 4
4 -
 5
5 -
 6
6 -
 7
7 -
 8
8 -
 9
9 -
 10
10 -
 11
11 -
 12
12 -
 13
13 -
 14
14 -
 15
15 -
 16
16 -
 17
17 -
 18
18 -
 19
19 -
 20
20 -
 21
21 -
 22
22 -
23
-
24
-
25
-
26
-
27
-
28
-
29
-
30
-
31
-
32
-
33
-
34
-
35
-
36
-
37
-
38
-
39
-
40
-
41
-
42
-
43
-
44
-
45
-
46
-
47
-
48
-
49
-
50
-
51
-
52
-
53
-
54
-
55
-
56
-
57
-
58
-
59
-
60
-
61
-
62
-
63
-
64
-
65
-
66
-
67
-
68
-
69
-
70
-
71
-
72
-
73
-
74
-
75
-
76
-
77
-
78
-
79
-
80
-
81
-
82
-
83
-
84
-
85
-
86
-
87
-
88
-
89
-
90
-
91
-
92
-
93
-
94
-
95
-
96
-
97
-
98
-
99
-
100
-
101
-
102
-
103
-
104
-
105
-
106
-
107
-
108
-
109
-
110
-
111
-
112
-
113
-
114
-
115
-
116
-
117
-
118
-
119
-
120
-
121
-
122
-
123
-
124
-
125
-
126
-
127
-
128
-
129
-
130
-
131
-
132
-
133
-
134
-
135
-
136
-
137
-
138
-
139
-
140
-
141
-
142
-
143
-
144
-
145
-
146
-
147
-
148
-
149
-
150
-
151
-
152
-
153
-
154
-
155
-
156
-
157
-
158
-
159
-
160
-
161
-
162
-
163
-
164
-
165
-
166
-
167
-
168
-
169
-
170
-
171
-
172
-
173
-
174
-
175
-
176
-
177
-
178
-
179
-
180
-
181
-
182
-
183
-
184
-
185
-
186
-
187
-
188
-
189
-
190
-
191
-
192
 |
 |

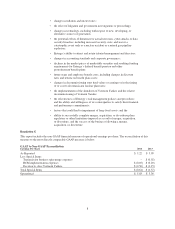
ENTERGY CORPORATION AND SUBSIDIARIES
Five-Year Summary of Selected Financial and Operating Data
2014 2013 2012 2011 2010
Selected Financial Data:
(In Thousands, Except Percentages and Per Share Amounts)
Operating revenues $ 12,494,921 $ 11,390,947 $ 10,302,079 $ 11,229,073 $ 11,487,577
Income from continuing operations $ 960,257 $ 730,572 $ 868,363 $ 1,367,372 $ 1,270,305
Earnings per share from continuing operations:
Basic $ 5.24 $ 3.99 $ 4.77 $ 7.59 $ 6.72
Diluted $ 5.22 $ 3.99 $ 4.76 $ 7.55 $ 6.66
Dividends declared per share $ 3.32 $ 3.32 $ 3.32 $ 3.32 $ 3.24
Return on common equity 9.58% 7.56% 9.33% 15.43% 14.61%
Book value per share, year-end $ 55.83 $ 54.00 $ 51.72 $ 50.81 $ 47.53
Total assets $ 46,527,854 $ 43,406,446 $ 43,202,502 $ 40,701,699 $ 38,685,276
Long-term obligations(a) $ 12,740,579 $ 12,382,127 $ 12,141,370 $ 10,268,645 $ 11,575,973
Utility Electric Operating Revenues:
(In Millions)
Residential $ 3,555 $ 3,396 $ 3,022 $ 3,369 $ 3,375
Commercial 2,553 2,415 2,174 2,333 2,317
Industrial 2,623 2,405 2,034 2,307 2,207
Governmental 227 218 198 205 212
Total retail 8,958 8,434 7,428 8,214 8,111
Sales for resale 330 210 179 216 389
Other 304 298 264 244 241
Total $ 9,592 $ 8,942 $ 7,871 $ 8,674 $ 8,741
Utility Billed Electric Energy Sales:
(GWh)
Residential 35,932 35,169 34,664 36,684 37,465
Commercial 28,827 28,547 28,724 28,720 28,831
Industrial 43,723 41,653 41,181 40,810 38,751
Governmental 2,428 2,412 2,435 2,474 2,463
Total retail 110,910 107,781 107,004 108,688 107,510
Sales for resale 9,462 3,020 3,200 4,111 4,372
Total 120,372 110,801 110,204 112,799 111,882
Entergy Wholesale Commodities:
Operating revenues $ 2,719 $ 2,313 $ 2,326 $ 2,414 $ 2,566
Billed electric energy sales (Gwh) 44,424 45,127 46,178 43,497 42,934
(a) Includes long-term debt (excluding currently maturing debt), noncurrent capital lease obligations, and subsidiary preferred stock without sinking fund that is
not presented as equity on the balance sheet.
Comparison of Five-Year Cumulative Return
The following graph compares the performance of the common stock of Entergy Corporation to the S&P 500 Index and the
Philadelphia Utility Index (each of which includes Entergy Corporation) for the last five years ended December 31.
$250
$200
$150
$100
$50
2009 2010 2011 2012 2013 2014
Entergy
Corporation
S&P 500 Index
Philadelphia
Utility Index
2009 2010 2011 2012 2013 2014
Entergy
Corporation $100.00 $ 90.27 $ 97.75 $ 89.57 $ 93.47 $135.30
S&P 500
Index $100.00 $115.06 $117.48 $136.27 $180.39 $205.07
Philadelphia
Utility Index $100.00 $105.70 $126.04 $125.32 $139.08 $179.33
Assumes $100 invested at the closing price on Dec. 31, 2009, in Entergy Corporation common
stock, the S&P 500 Index, and the Philadelphia Utility Index, and reinvestment of all dividends.
Source: Bloomberg
9