Emerson 2009 Annual Report Download - page 21
Download and view the complete annual report
Please find page 21 of the 2009 Emerson annual report below. You can navigate through the pages in the report by either clicking on the pages listed below, or by using the keyword search tool below to find specific information within the annual report.-
 1
1 -
2
-
3
-
4
-
5
-
6
-
7
-
8
-
9
-
10
-
 11
11 -
 12
12 -
 13
13 -
 14
14 -
 15
15 -
 16
16 -
 17
17 -
 18
18 -
 19
19 -
 20
20 -
 21
21 -
 22
22 -
 23
23 -
 24
24 -
 25
25 -
 26
26 -
 27
27 -
 28
28 -
 29
29 -
 30
30 -
 31
31 -
32
-
33
-
34
-
35
-
36
-
37
-
38
-
39
-
40
-
41
-
42
-
43
-
44
-
45
-
46
-
47
-
48
-
49
-
50
-
51
-
52
-
53
-
54
-
55
-
56
 |
 |

Annual Report 19
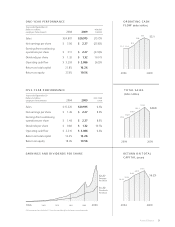
(d o l l A R s in m i l l i o n s ) 2007 2008 2009
Operating Cash Flow $3,016 3,293
Percent of sales 13.4% 13.3% 14.8%
Capital Expenditures $ 681 714
Percent of sales 3.0% 2.9% 2.6%
Free Cash Flow (Operating Cash
Flow less Capital Expenditures) $2,335 2,579
Percent of sales 10.3% 10.4% 12.2%
Operating Working Capital $1,915 2,202
Percent of sales 8.5% 8.9% 8.2%
Emerson generated operating cash ow of $3.1 billion
in 2009, a 6 percent decrease from 2008 due to lower
earnings and increased pension funding, partially offset
by signicant savings from continued improvements
in operating working capital management. The cash
operating working capital reduction of $620 million
included accounts receivable and inventory liquidations
of $1,011 million and $580 million, respectively, partially
offset by an accounts payable reduction of $709 million.
Given the signicant operating working capital reduction
in 2009, the Company expects operating cash ow to
decline in scal 2010. Operating cash ow was $3.3 billion
in 2008, a 9 percent increase from 2007, driven by higher
net earnings. At September 30, 2009, operating working
capital as a percent of sales was 8.2 percent, compared
with 8.9 percent and 8.5 percent in 2008 and 2007,
respectively. Pension contributions were $303 million,
$135 million and $136 million in 2009, 2008 and 2007,
respectively.
Free cash ow (operating cash ow less capital expendi-
tures) was $2.6 billion in both 2009 and 2008, compared
with $2.3 billion in 2007. The 10 percent increase in
free cash ow in 2008 compared with 2007 reects the
increase in operating cash ow, partially offset by higher
capital spending. Capital expenditures were $531 million,
$714 million and $681 million in 2009, 2008 and 2007,
respectively. The decrease in capital expenditures during
2009 compared with the prior year was primarily due
to the overall decline in worldwide business, while the
increase in 2008 compared with 2007 was primarily due
to capacity expansion in the Process Management and
Industrial Automation segments and construction of a
corporate data center. In 2010, the Company is targeting
capital spending of approximately $500 million. Net cash
paid in connection with acquisitions was $776 million,
$561 million and $295 million in 2009, 2008 and 2007,
respectively.
Dividends were $998 million ($1.32 per share, up
10 percent) in 2009, compared with $940 million
($1.20 per share) in 2008 and $837 million ($1.05 per
share) in 2007. In November 2009, the Board of Directors
voted to increase the quarterly cash dividend 1.5 percent
to an annualized rate of $1.34 per share. In 2008, the
Board of Directors approved a program for the repur-
chase of up to 80 million common shares to augment
an existing 2002 plan. In 2009, 21.0 million shares were
repurchased under the scal 2008 authorization; in 2008,
22.4 million shares were repurchased under the scal
2002 and 2008 authorizations; and in 2007, 18.9 million
shares were repurchased under the 2002 authoriza-
tion. 51.4 million shares remain available for repurchase
under the 2008 authorization and zero remain available
under the 2002 authorization. Purchases of Emerson
common stock totaled $695 million, $1,128 million and
$849 million in 2009, 2008 and 2007, respectively, at
an average price paid per share of $33.09, $50.31 and
$44.98, respectively.
(d o l l A R s in m i l l i o n s ) 2007 2008 2009
Total Assets $19,680 21,040
Long-term Debt $ 3,372 3,297
Stockholders’ Equity $ 8,772 9,113
Total Debt-to-Capital Ratio 30.1% 33.1%
Net Debt-to-Net Capital Ratio 23.6% 22.7%
Operating Cash Flow-to-Debt Ratio 79.9% 72.9%
Interest Coverage Ratio 12.9X 15.7X
Total debt, which includes short-term borrowings and
current maturities of long-term debt, was $4.6 billion,
$4.5 billion and $3.8 billion for 2009, 2008 and 2007,
respectively. During 2009, the Company issued
$250 million of 4.125% notes due April 2015, $250 million
of 5.00% notes due April 2019, $250 million of 6.125%
notes due April 2039 and $500 million of 4.875% notes
due October 2019, and repaid $175 million of 5% notes
and $250 million of 5.85% notes that had matured. In
November 2009, the Company issued $300 million of
4.25% notes due November 2020 and $300 million of
5.25% notes due November 2039. During 2008, the
Company issued $400 million of 5.25% notes due
October 2018 and repaid $250 million of 5.5% notes
that had matured. During 2007, the Company issued
$250 million of 5.125% notes due December 2016 and
$250 million of 5.375% notes due October 2017.
The total debt-to-capital ratio was 34.8 percent at year
end 2009, compared with 33.1 percent for 2008 and
30.1 percent for 2007. At September 30, 2009, net debt
(total debt less cash and short-term investments) was
25.7 percent of net capital, compared with 22.7 percent