Emerson 2006 Annual Report Download - page 2
Download and view the complete annual report
Please find page 2 of the 2006 Emerson annual report below. You can navigate through the pages in the report by either clicking on the pages listed below, or by using the keyword search tool below to find specific information within the annual report.-
 1
1 -
 2
2 -
 3
3 -
 4
4 -
 5
5 -
 6
6 -
 7
7 -
 8
8 -
 9
9 -
 10
10 -
 11
11 -
 12
12 -
 13
13 -
14
-
15
-
16
-
17
-
18
-
19
-
20
-
21
-
22
-
23
-
24
-
25
-
26
-
27
-
28
-
29
-
30
-
31
-
32
-
33
-
34
-
35
-
36
-
37
-
38
-
39
-
40
-
41
-
42
-
43
-
44
-
45
-
46
-
47
-
48
-
49
-
50
-
51
-
52
-
53
-
54
-
55
-
56
-
57
-
58
-
59
-
60
-
61
-
62
-
63
-
64
-
65
-
66
-
67
-
68
 |
 |

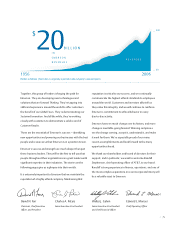
1956 1966 1976 1986 1996 2006
Financial Highlights and Letter to Shareholders
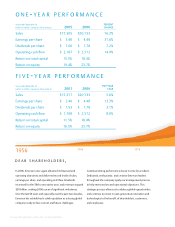
d e a r s h a r e h o l d e r s ,
In 2006, Emerson once again obtained its nancial and
operating objectives and delivered record levels of sales,
earnings per share, and operating cash ow. Dividends
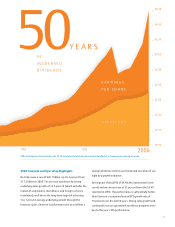
increased for the 50th consecutive year, and revenues topped
$20 billion, making 2006 a year of signicant milestones.
Over the last 50 years and especially over the past two decades,
Emerson has established a solid reputation as a strong global
company ready to face current and future challenges.
Continual strong performance doesn’t come by accident.
Dedicated, enthusiastic, and creative Emerson leaders
throughout the company apply our management process
to help meet and exceed operational objectives. This
strategic process allows us to address global opportunities
and continue to invest in next-generation innovation and
technologies to the benet of shareholders, customers,
and employees.
o n e -y e a r p e r f o r m a n c e
Years ended September 30 percent
Dollars in millions, except per share amounts2005 2006 change
Sales $17,305 $20,13316.3%
Earnings per share $ 3.40 $ 4.48 31.8%
Dividends per share $ 1.66 $ 1.78 7.2%
Operating cash ow $ 2,187 $ 2,512 14.9%
Return on total capital 15.5% 18.4%
Return on equity 19.4% 23.7%
f i v e -y e a r p e r f o r m a n c e
Years ended September 30 five-year
Dollars in millions, except per share amounts2001 2006 cagr
Sales $15,311 $20,1335.6%
Earnings per share $ 2.40 $ 4.48 13.3%
Dividends per share $ 1.53 $ 1.78 3.1%
Operating cash ow $ 1,708 $ 2,512 8.0%
Return on total capital 11.5% 18.4%
Return on equity 16.5% 23.7%