Electrolux 2002 Annual Report Download - page 4
Download and view the complete annual report
Please find page 4 of the 2002 Electrolux annual report below. You can navigate through the pages in the report by either clicking on the pages listed below, or by using the keyword search tool below to find specific information within the annual report.-
 1
1 -
 2
2 -
 3
3 -
 4
4 -
 5
5 -
 6
6 -
 7
7 -
 8
8 -
 9
9 -
 10
10 -
 11
11 -
 12
12 -
 13
13 -
 14
14 -
 15
15 -
16
-
17
-
18
-
19
-
20
-
21
-
22
-
23
-
24
-
25
-
26
-
27
-
28
-
29
-
30
-
31
-
32
-
33
-
34
-
35
-
36
-
37
-
38
-
39
-
40
-
41
-
42
-
43
-
44
-
45
-
46
-
47
-
48
-
49
-
50
-
51
-
52
-
53
-
54
-
55
-
56
-
57
-
58
-
59
-
60
-
61
-
62
-
63
-
64
-
65
-
66
-
67
-
68
-
69
-
70
-
71
-
72
-
73
-
74
-
75
-
76
-
77
-
78
-
79
-
80
-
81
-
82
-
83
-
84
-
85
 |
 |

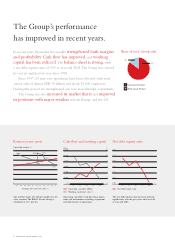
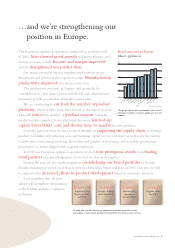
84%
16%
Consumer Durables
Professional Products
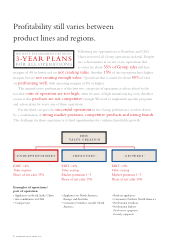
In recent years, Electrolux has steadily strengthened both margins
and profitability. Cash flow has improved, and working
capital has been reduced.The balance sheet is strong, with
a net debt/equity ratio of 0.05 at year-end 2002.The Group has covered
its cost of capital every year since 1998.
Since 1997, 24 non-core operations have been divested, with total
annual sales of almost SEK 30 billion and about 25,000 employees.
During this period, we strengthened our core areas through acquisitions.
The Group has also increased its market shares and improved
its positions with major retailers in both Europe and the US.
Net debt/equity ratio
0201009998
0.00
0.15
0.30
0.45
0.60
0.75
0.90
Cash flow and working capital Net debt/equity ratio
Operating cash flow: Cash flow from opera-
tions and investments excluding acquistions
and divestments of operations.
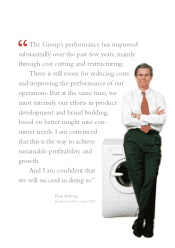
The Group’s performance
has improved in recent years.
SEKm %
0
2,000
4,000
6,000
8,000
10,000
12,000
Operating cash flow, SEKm
0201009998
0
2
4
6
8
10
12
Working capital/net sales, %
Return on net assets
The red line shows the Group’s hurdle rate for
value creation.The WACC for the Group is
calculated at 13% pre-tax.
The net debt/equity ratio has been reduced
significantly over the past years and was 0.05
at year-end 2002.
Share of total Group sales
0
1
2
3
4
5
6
7
3736353433323130292827
Average net assets/net sales, %
2002
2001
2000 1999
1998
1997
Operating margin, %