Dominion Power 2015 Annual Report Download - page 18
Download and view the complete annual report
Please find page 18 of the 2015 Dominion Power annual report below. You can navigate through the pages in the report by either clicking on the pages listed below, or by using the keyword search tool below to find specific information within the annual report.-
 1
1 -
2
-
3
-
4
-
5
-
6
-
7
-
 8
8 -
 9
9 -
 10
10 -
 11
11 -
 12
12 -
 13
13 -
 14
14 -
 15
15 -
 16
16 -
 17
17 -
 18
18 -
 19
19 -
 20
20 -
 21
21 -
 22
22 -
 23
23 -
 24
24 -
 25
25 -
 26
26 -
 27
27 -
 28
28
 |
 |

16
DOMINION RESOURCES 2015 SUMMARY ANNUAL REPORT
DOMINION
PERFORMANCE CHARTS
* All planned expenditures are preliminary and may be
subject to regulatory and/or Board of Directors approvals.
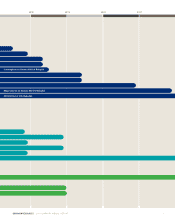
INFRASTRUCTURE INVESTMENT
Dollars in Billions
Cumulative Planned Growth Capital Expenditures*
2016 2017
8.9
5.5
2018
11.6
2019
13.6
2020
15.7
TOTAL RETURN COMPARISON
Dominion vs. Indices 1, 3 and 5 Year Total Returns Percent /Through Dec. 31, 2015 Source: Bloomberg
Dominion Resources S&P 500 Utilities Index Philadelphia Utility Index S&P 500 Index
RELIABILITY IMPROVEMENTS
SAIDI — Excluding Major Storms
Three-Year Rolling Average SLIGHT INCREASE DUE TO
10% MORE WEATHER-RELATED
EVENTS IN 2015 AS COMPARED
TO 3-YEAR AVERAGE.
Avg. Number of Minutes Out
Per Customer
2004– 06 20 05 – 07 2006 –0 8 2007– 09 2008–10 2009 –11 2010 –12 2011–13
111
2012–14
150
10 0
50
152 151 151
143 139
137
130
120
113
2013–15
GROWTH PLAN BENEFITS COMMUNITIES
$37.8B*
Growth
43,706
Construction
Jobs
$714M
Local Property
Tax Revenue
Figures are estimated growth capital expenditures, construction jobs and local taxes
from 2007–2020.
* All planned capital expenditures are based on the capital expenditures plan reviewed
and endorsed by Dominion’s Board of Directors in late 2015. Dominion undertakes
no obligation to update this information to reflect plan or project-specific developments,
including regulatory developments, or other updates until the next annual update of
the plan. Actual capital expenditures may be subject to Board of Directors approval
and/or regulatory approval and may vary from these estimates.
1
00
80
60
40
20
0
1-YEAR
-20
3-YEARS 5-YEARS
-8.74
45.53 38.94 34.16
52.51
91.44
68.67
58.99
80.56
-4.83 -6.24 1.38
CO2 INTENSITY — DOMINION
VIRGINIA POWER
Emissions Intensity Reductions (lbs/MWh)
CO2 (Carbon Dioxide)
21% DECREASE IN CO2
EMISSIONS INTENSITY
2000–2014
2002 2003 2004 2005 2006 2007 2008 2009 2010 2011 2012 2013 2014
1,300
1,200
1,100
1,000
900
800
1,224
1,231
1,259
1,222
1,192
1,219
1,175
1,181
1,105
1,070
1,085
978
879
980
969
2000 2001