Dollar General 2003 Annual Report Download - page 15
Download and view the complete annual report
Please find page 15 of the 2003 Dollar General annual report below. You can navigate through the pages in the report by either clicking on the pages listed below, or by using the keyword search tool below to find specific information within the annual report.-
 1
1 -
2
-
3
-
4
-
 5
5 -
 6
6 -
 7
7 -
 8
8 -
 9
9 -
 10
10 -
 11
11 -
 12
12 -
 13
13 -
 14
14 -
 15
15 -
 16
16 -
 17
17 -
 18
18 -
 19
19 -
 20
20 -
 21
21 -
 22
22 -
 23
23 -
 24
24 -
 25
25 -
26
-
27
-
28
-
29
-
30
-
31
-
32
-
33
-
34
-
35
-
36
-
37
-
38
-
39
-
40
-
41
-
42
-
43
-
44
-
45
-
46
-
47
-
48
-
49
-
50
-
51
-
52
-
53
-
54
 |
 |

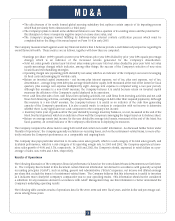
Net Sales. Increases in net sales resulted primarily from 587 net new stores and a same-store sales increase of 4.0% in 2003 com-
pared to 2002, and 573 net new stores and a same-store sales increase of 5.7% in 2002 compared to 2001. Same-store sales cal-
culations for a given period include only those stores that were open both at the end of that period and at the beginning of the pre-
ceding fiscal year. The Company monitors its sales internally by the four major categories noted in the table above. The Company’s
merchandising strategy in recent years has been to place a greater emphasis on faster-turning consumable products and to give
less prominence to slower-turning home products and clothing. The Company believes that this strategy has enabled it to better
serve its customers while improving its inventory turns. As a result of this strategy, over the past three years the highly consum-
able category has become a greater percentage of the Company’s overall sales mix while the percentages of the home products and
basic clothing categories have declined.
The Company’s same-store sales increase in 2003 over 2002 of 4.0%, or $228.3 million, was due to a number of factors, including
but not limited to: increased sales of candy and snacks of $64 million, which can be partially attributed to the introduction of new
items and the placement of many of the items in this category near the front of the store; an increase of $31 million in sales of
health and beauty aids items due primarily to improved in-stocks and increased sales of certain over-the-counter medications; an
increase of $30 million in sales of pet supplies primarily due to the success of private label pet foods and the addition during the
year of certain pet accessories; an increase of approximately $30 million in sales of perishable products primarily due to the increase
in the number of stores with coolers; and an increase of $24 million in sales of hard goods due primarily to expanded offerings of
automotive products.
The Company’s same-store sales increase in 2002 over 2001 of 5.7%, or $284.0 million, was due to a number of factors, including
but not limited to: the introduction of approximately 400 new items in the highly consumable category which, net of the sales of
the items they replaced, generated an estimated $85 million increase in same-store sales; a strong performance of seasonal mer-
chandise in the first half of 2002, which increased same-store sales by an estimated $42 million during that period, a portion of
which the Company attributes to the introduction of new outdoor items and the staging of warm weather items in its stores earli-
er than in prior years; an increase of approximately $25 million in sales of perishable products primarily due to the increase in the
number of stores with coolers; and improved ordering practices by its store employees.
Gross Profit. The gross profit rate increased 111 basis points in 2003 as compared with 2002 primarily due to the following:
•Higher initial mark-ups on merchandise received during 2003 as compared with 2002 (approximately 59 basis points of
gross margin improvement). This improvement was achieved primarily from increased purchases of higher margin
seasonal and home product items; a 31% increase in imported purchases, which carry higher than average mark-ups; and
a 72% increase in various performance-based vendor rebates.
•A reduction in the Company’s shrink provision from 3.52% in 2002 to 3.05% in 2003, calculated using retail dollars as a
percentage of sales (approximately 41 basis points of gross margin improvement, at cost). The Company made progress
in reducing the shrink at problem stores during 2003 but generally fell short of corporate goals. The 3.05% recorded in the
current year exceeds the shrinkage rate recorded in each of the four fiscal years between 1998 and 2001 (2.60%, 2.62%,
2.80% and 2.90%, respectively) and also exceeded the Company’s internal plan for 2003. Some of the actions taken by the
Company to combat shrink beginning in 2002 included the development of an asset protection department devoted to
reducing shrink losses, the installation and utilization of software that identifies unusual cash register transactions,
increasing the emphasis of shrink in the store bonus plan and the establishment of a multi-disciplinary shrink task force
that has developed a comprehensive shrink reduction action plan, which included the increased use of closed circuit
television monitors and burglar alarms, a specific high shrink store action plan, the creation of various shrink awareness
tools and the production of various exception reports to identify high risk stores. As mentioned in the Executive Overview
above, a continued emphasis on shrink reduction has been identified as a significant operating initiative for 2004.
•Higher average mark-ups on the Company’s beginning inventory in 2003 as compared to 2002 (approximately 18 basis
points of gross margin improvement). This increased average mark-up represents the cumulative impact of higher margin
purchases over time.
•A reduction in transportation expenses as a percentage of sales (approximately 14 basis points of gross margin
improvement). This reduction resulted primarily from system enhancements and improved process efficiencies in
managing outbound freight costs, which contributed to an approximate 7% decline in outbound cost per carton delivered
in 2003 as compared to 2002.
These components of margin, which all positively impacted the Company’s results, were partially offset by:
•The impact of the Company’s LIFO valuation adjustments in the fourth quarters of 2003 versus 2002 (approximately 16
basis points of gross margin decline). In 2002, the Company recorded an $8.9 million LIFO adjustment, which had the effect
M D & A
13