Dollar General 2003 Annual Report Download - page 11
Download and view the complete annual report
Please find page 11 of the 2003 Dollar General annual report below. You can navigate through the pages in the report by either clicking on the pages listed below, or by using the keyword search tool below to find specific information within the annual report.-
 1
1 -
 2
2 -
 3
3 -
 4
4 -
 5
5 -
 6
6 -
 7
7 -
 8
8 -
 9
9 -
 10
10 -
 11
11 -
 12
12 -
 13
13 -
 14
14 -
 15
15 -
 16
16 -
 17
17 -
 18
18 -
 19
19 -
 20
20 -
 21
21 -
 22
22 -
23
-
24
-
25
-
26
-
27
-
28
-
29
-
30
-
31
-
32
-
33
-
34
-
35
-
36
-
37
-
38
-
39
-
40
-
41
-
42
-
43
-
44
-
45
-
46
-
47
-
48
-
49
-
50
-
51
-
52
-
53
-
54
 |
 |

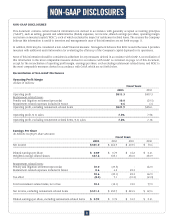
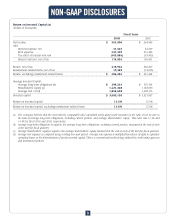
NON-GAAP DISCLOSURES
9
Return on Invested Capital (a)
(Dollars in thousands)
Fiscal Years
________________________________________________________________________________________________________________________________
2003 2002
________________________________________________________________________________________________________________________________
Net income $ 301,000 $ 264,946
Add:
Interest expense, net 31,503 42,639
Rent expense 247,309 216,345
Tax effect of interest and rent (103,886) (93,493)
_______________________________________________________________________________________________________________________________
Interest and rent, net of tax 174,926 165,491
_______________________________________________________________________________________________________________________________
Return, net of tax 475,926 430,437
Restatement-related items, net of tax 10,359 (14,073)
_______________________________________________________________________________________________________________________________
Return, excluding restatement-related items $ 486,285 $ 416,364
_______________________________________________________________________________________________________________________________
Average Invested Capital:
Average long-term obligations (b) $ 309,234 $ 570,764
Shareholders' equity (c) 1,421,308 1,148,030
Average rent x 8 (d) 1,854,608 1,608,713
_______________________________________________________________________________________________________________________________
Invested capital $ 3,585,150 $ 3,327,507
Return on invested capital 13.3% 12.9%
_______________________________________________________________________________________________________________________________
_______________________________________________________________________________________________________________________________
Return on invested capital, excluding restatement-related items 13.6% 12.5%
_______________________________________________________________________________________________________________________________
_______________________________________________________________________________________________________________________________
(a) The Company believes that the most directly comparable ratio calculated solely using GAAP measures is the ratio of net income to
the sum of average long-term obligations, including current portion, and average shareholders' equity. This ratio was 17.4% and
15.4% for fiscal 2003 and 2002, respectively.
(b) Average long-term obligations is equal to the average long-term obligations, including current portion, measured at the end of each
of the last five fiscal quarters.
(c) Average shareholders' equity is equal to the average shareholders' equity measured at the end of each of the last five fiscal quarters.
(d) Average rent expense is computed using a rolling two-year period. Average rent expense is multiplied by a factor of eight to capitalize
operating leases in the determination of pretax invested capital. This is a conventional methodology utilized by credit rating agencies
and investment bankers.