Dillard's 2012 Annual Report Download - page 19
Download and view the complete annual report
Please find page 19 of the 2012 Dillard's annual report below. You can navigate through the pages in the report by either clicking on the pages listed below, or by using the keyword search tool below to find specific information within the annual report.-
 1
1 -
2
-
3
-
4
-
5
-
6
-
7
-
8
-
 9
9 -
 10
10 -
 11
11 -
 12
12 -
 13
13 -
 14
14 -
 15
15 -
 16
16 -
 17
17 -
 18
18 -
 19
19 -
 20
20 -
 21
21 -
 22
22 -
 23
23 -
 24
24 -
 25
25 -
 26
26 -
 27
27 -
 28
28 -
 29
29 -
30
-
31
-
32
-
33
-
34
-
35
-
36
-
37
-
38
-
39
-
40
-
41
-
42
-
43
-
44
-
45
-
46
-
47
-
48
-
49
-
50
-
51
-
52
-
53
-
54
-
55
-
56
-
57
-
58
-
59
-
60
-
61
-
62
-
63
-
64
-
65
-
66
-
67
-
68
-
69
-
70
-
71
-
72
-
73
-
74
-
75
-
76
-
77
-
78
-
79
-
80
-
81
-
82
-
83
-
84
-
85
-
86
 |
 |

23MAR201306402465
In March 2013, the Company completed the purchase of the $92.0 million outstanding at
February 2, 2013 under the February 2012 plan. The Company also announced that the Board of
Directors authorized the repurchase of up to an additional $250 million of its Class A Common Stock.
This authorization permits the Company to repurchase its Class A Common Stock in the open market,
pursuant to preset trading plans meeting the requirements of Rule 10b5-1 under the Exchange Act or
through privately negotiated transactions. The plan has no expiration date.
Securities Authorized for Issuance under Equity Compensation Plans
The information concerning the Company’s equity compensation plans is incorporated by reference
here to Item 12 of this Annual Report on Form 10-K under the heading ‘‘Equity Compensation Plan
Information’’.
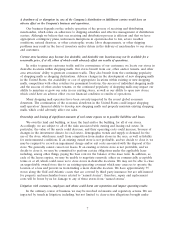
Company Performance
For each of the last five fiscal years, the graph below compares the cumulative total returns on the
Company’s Class A Common Stock, the Standard & Poor’s 500 Index and the Standard & Poor’s 500
Department Stores Index. The cumulative total return assumes $100 invested in the Company’s Class A
Common Stock and each of the indices at market close on February 1, 2008 (the last trading day prior
to the start of fiscal 2008) and assumes reinvestment of dividends.
Stock Performance Graph
$500
$450
$400
$350
$300
$250
$200
$150
$100
$50
$0
2008 2009 2010
Fiscal Year
2011 2012
Dollars
Dillard’s S&P 500 S&P 500 Dept Stores
The table below shows the dollar value of the respective $100 investments, with the assumptions
noted above, in each of the Company’s Class A Common Stock, the Standard & Poor’s 500 Index and
the Standard & Poor’s 500 Department Stores Index as of the last day of each of the Company’s last
five fiscal years.
2008 2009 2010 2011 2012
Dillard’s, Inc. .............................. $21.59 $83.47 $203.93 $234.99 $472.84
S&P 500 .................................. 60.63 80.72 97.88 103.09 121.54
S&P 500 Department Stores .................... 47.23 78.96 90.56 102.25 104.73
15