Delta Airlines 2014 Annual Report Download - page 60
Download and view the complete annual report
Please find page 60 of the 2014 Delta Airlines annual report below. You can navigate through the pages in the report by either clicking on the pages listed below, or by using the keyword search tool below to find specific information within the annual report.-
 1
1 -
2
-
3
-
4
-
5
-
6
-
7
-
8
-
9
-
10
-
11
-
12
-
13
-
14
-
15
-
16
-
17
-
18
-
19
-
20
-
21
-
22
-
23
-
24
-
25
-
26
-
27
-
28
-
29
-
30
-
31
-
32
-
33
-
34
-
35
-
36
-
37
-
38
-
39
-
40
-
41
-
42
-
43
-
44
-
45
-
46
-
47
-
48
-
49
-
 50
50 -
 51
51 -
 52
52 -
 53
53 -
 54
54 -
 55
55 -
 56
56 -
 57
57 -
 58
58 -
 59
59 -
 60
60 -
 61
61 -
 62
62 -
 63
63 -
 64
64 -
 65
65 -
 66
66 -
 67
67 -
 68
68 -
 69
69 -
 70
70 -
71
-
72
-
73
-
74
-
75
-
76
-
77
-
78
-
79
-
80
-
81
-
82
-
83
-
84
-
85
-
86
-
87
-
88
-
89
-
90
-
91
-
92
-
93
-
94
-
95
-
96
-
97
-
98
-
99
-
100
-
101
-
102
-
103
-
104
-
105
-
106
-
107
-
108
-
109
-
110
-
111
-
112
-
113
-
114
-
115
-
116
-
117
-
118
-
119
-
120
-
121
-
122
-
123
-
124
-
125
-
126
-
127
-
128
-
129
-
130
-
131
-
132
-
133
-
134
-
135
-
136
-
137
-
138
-
139
-
140
-
141
-
142
-
143
-
144
-
145
-
146
-
147
-
148
-
149
-
150
-
151
-
152
-
153
-
154
-
155
-
156
-
157
-
158
-
159
-
160
-
161
-
162
-
163
-
164
-
165
-
166
-
167
-
168
-
169
-
170
-
171
-
172
-
173
-
174
-
175
-
176
-
177
-
178
-
179
-
180
-
181
-
182
-
183
-
184
-
185
-
186
-
187
-
188
-
189
-
190
-
191
-
192
-
193
-
194
-
195
-
196
-
197
-
198
-
199
-
200
-
201
-
202
-
203
-
204
-
205
-
206
-
207
-
208
-
209
-
210
-
211
-
212
-
213
-
214
-
215
-
216
-
217
-
218
-
219
-
220
-
221
-
222
-
223
-
224
-
225
-
226
-
227
-
228
-
229
-
230
-
231
-
232
-
233
-
234
-
235
-
236
-
237
-
238
-
239
-
240
-
241
-
242
-
243
-
244
-
245
-
246
-
247
-
248
-
249
-
250
-
251
-
252
-
253
-
254
-
255
-
256
-
257
-
258
-
259
-
260
-
261
-
262
-
263
-
264
-
265
-
266
-
267
-
268
-
269
-
270
-
271
-
272
-
273
-
274
-
275
-
276
-
277
-
278
-
279
-
280
-
281
-
282
-
283
-
284
-
285
-
286
-
287
-
288
-
289
-
290
-
291
-
292
-
293
-
294
-
295
-
296
-
297
-
298
-
299
-
300
-
301
-
302
-
303
-
304
-
305
-
306
-
307
-
308
-
309
-
310
-
311
-
312
-
313
-
314
-
315
-
316
-
317
-
318
-
319
-
320
-
321
-
322
-
323
-
324
-
325
-
326
-
327
-
328
-
329
-
330
-
331
-
332
-
333
-
334
-
335
-
336
-
337
-
338
-
339
-
340
-
341
-
342
-
343
-
344
-
345
-
346
-
347
-
348
-
349
-
350
-
351
-
352
-
353
-
354
-
355
-
356
-
357
-
358
-
359
-
360
-
361
-
362
-
363
-
364
-
365
-
366
-
367
-
368
-
369
-
370
-
371
-
372
-
373
-
374
-
375
-
376
-
377
-
378
-
379
-
380
-
381
-
382
-
383
-
384
-
385
-
386
-
387
-
388
-
389
-
390
-
391
-
392
-
393
-
394
-
395
-
396
-
397
-
398
-
399
-
400
-
401
-
402
-
403
-
404
-
405
-
406
-
407
-
408
-
409
-
410
-
411
-
412
-
413
-
414
-
415
-
416
-
417
-
418
-
419
-
420
-
421
-
422
-
423
-
424
-
425
-
426
-
427
-
428
-
429
-
430
-
431
-
432
-
433
-
434
-
435
-
436
-
437
-
438
-
439
-
440
-
441
-
442
-
443
-
444
-
445
-
446
-
447
-
448
-
449
-
450
-
451
-
452
-
453
-
454
-
455
-
456
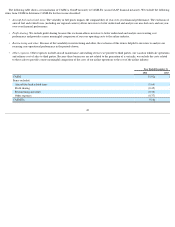
 |
 |

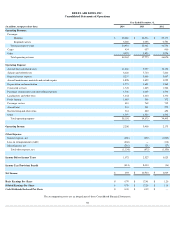
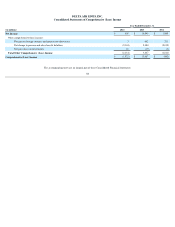
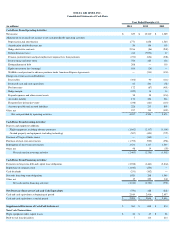
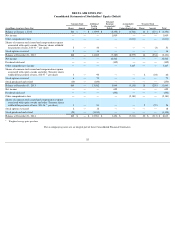
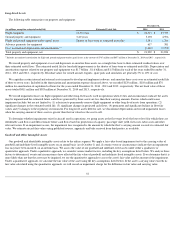
DELTA AIR LINES, INC.
Consolidated Statements of Cash Flows
Year Ended December 31,
(in millions) 2014
2013
2012
Cash Flows From Operating Activities:
Net income
$
659
$
10,540
$
1,009
Adjustments to reconcile net income to net cash provided by operating activities:
Depreciation and amortization
1,771
1,658
1,565
Amortization of debt discount, net
59
154
193
Hedge derivative contracts
2,186
(86
)
(209
)
Deferred income taxes
414
(7,991
)
17
Pension, postretirement and postemployment expense less than payments
(723
)
(624
)
(208
)
Restructuring and other items
758
285
184
Extinguishment of debt
268
—
118
Equity investment loss (earnings)
106
(24
)
—
SkyMiles used pursuant to advance purchase under American Express Agreements
—
(
333
)
(333
)
Changes in certain assets and liabilities:
Receivables
(302
)
90
(116
)
Restricted cash and cash equivalents
62
231
(51
)
Fuel inventory
172
(87
)
(451
)
Hedge margin
(922
)
14
14
Prepaid expenses and other current assets
58
28
(134
)
Air traffic liability
174
426
216
Frequent flyer deferred revenue
(238
)
(121
)
(115
)
Accounts payable and accrued liabilities
228
213
899
Other, net
217
131
(122
)
Net cash provided by operating activities
4,947
4,504
2,476
Cash Flows From Investing Activities:
Property and equipment additions:
Flight equipment, including advance payments
(1,662
)
(2,117
)
(1,196
)
Ground property and equipment, including technology
(587
)
(451
)
(772
)
Purchase of Virgin Atlantic shares
—
(
360
)
—
Purchase of short-term investments
(1,795
)
(959
)
(958
)
Redemption of short-term investments
1,533
1,117
1,019
Other, net
48
14
(55
)
Net cash used in investing activities
(2,463
)
(2,756
)
(1,962
)
Cash Flows From Financing Activities:
Payments on long-term debt and capital lease obligations
(2,928
)
(1,461
)
(2,864
)
Repurchase of common stock
(1,100
)
(250
)
—
Cash dividends
(251
)
(102
)
—
Proceeds from long-term obligations
1,020
268
1,965
Other, net
19
225
144
Net cash used in financing activities
(3,240
)
(1,320
)
(755
)
Net (Decrease) Increase in Cash and Cash Equivalents
(756
)
428
(241
)
Cash and cash equivalents at beginning of period
2,844
2,416
2,657
Cash and cash equivalents at end of period
$
2,088
$
2,844
$
2,416
Supplemental Disclosure of Cash Paid for Interest
$
560
$
698
$
834
Non-Cash Transactions:
Flight equipment under capital leases
$
28
$
67
$
28
Built-to-suit leased facilities
7
114
214