Delta Airlines 2014 Annual Report Download - page 39
Download and view the complete annual report
Please find page 39 of the 2014 Delta Airlines annual report below. You can navigate through the pages in the report by either clicking on the pages listed below, or by using the keyword search tool below to find specific information within the annual report.-
 1
1 -
2
-
3
-
4
-
5
-
6
-
7
-
8
-
9
-
10
-
11
-
12
-
13
-
14
-
15
-
16
-
17
-
18
-
19
-
20
-
21
-
22
-
23
-
24
-
25
-
26
-
27
-
28
-
 29
29 -
 30
30 -
 31
31 -
 32
32 -
 33
33 -
 34
34 -
 35
35 -
 36
36 -
 37
37 -
 38
38 -
 39
39 -
 40
40 -
 41
41 -
 42
42 -
 43
43 -
 44
44 -
 45
45 -
 46
46 -
 47
47 -
 48
48 -
 49
49 -
50
-
51
-
52
-
53
-
54
-
55
-
56
-
57
-
58
-
59
-
60
-
61
-
62
-
63
-
64
-
65
-
66
-
67
-
68
-
69
-
70
-
71
-
72
-
73
-
74
-
75
-
76
-
77
-
78
-
79
-
80
-
81
-
82
-
83
-
84
-
85
-
86
-
87
-
88
-
89
-
90
-
91
-
92
-
93
-
94
-
95
-
96
-
97
-
98
-
99
-
100
-
101
-
102
-
103
-
104
-
105
-
106
-
107
-
108
-
109
-
110
-
111
-
112
-
113
-
114
-
115
-
116
-
117
-
118
-
119
-
120
-
121
-
122
-
123
-
124
-
125
-
126
-
127
-
128
-
129
-
130
-
131
-
132
-
133
-
134
-
135
-
136
-
137
-
138
-
139
-
140
-
141
-
142
-
143
-
144
-
145
-
146
-
147
-
148
-
149
-
150
-
151
-
152
-
153
-
154
-
155
-
156
-
157
-
158
-
159
-
160
-
161
-
162
-
163
-
164
-
165
-
166
-
167
-
168
-
169
-
170
-
171
-
172
-
173
-
174
-
175
-
176
-
177
-
178
-
179
-
180
-
181
-
182
-
183
-
184
-
185
-
186
-
187
-
188
-
189
-
190
-
191
-
192
-
193
-
194
-
195
-
196
-
197
-
198
-
199
-
200
-
201
-
202
-
203
-
204
-
205
-
206
-
207
-
208
-
209
-
210
-
211
-
212
-
213
-
214
-
215
-
216
-
217
-
218
-
219
-
220
-
221
-
222
-
223
-
224
-
225
-
226
-
227
-
228
-
229
-
230
-
231
-
232
-
233
-
234
-
235
-
236
-
237
-
238
-
239
-
240
-
241
-
242
-
243
-
244
-
245
-
246
-
247
-
248
-
249
-
250
-
251
-
252
-
253
-
254
-
255
-
256
-
257
-
258
-
259
-
260
-
261
-
262
-
263
-
264
-
265
-
266
-
267
-
268
-
269
-
270
-
271
-
272
-
273
-
274
-
275
-
276
-
277
-
278
-
279
-
280
-
281
-
282
-
283
-
284
-
285
-
286
-
287
-
288
-
289
-
290
-
291
-
292
-
293
-
294
-
295
-
296
-
297
-
298
-
299
-
300
-
301
-
302
-
303
-
304
-
305
-
306
-
307
-
308
-
309
-
310
-
311
-
312
-
313
-
314
-
315
-
316
-
317
-
318
-
319
-
320
-
321
-
322
-
323
-
324
-
325
-
326
-
327
-
328
-
329
-
330
-
331
-
332
-
333
-
334
-
335
-
336
-
337
-
338
-
339
-
340
-
341
-
342
-
343
-
344
-
345
-
346
-
347
-
348
-
349
-
350
-
351
-
352
-
353
-
354
-
355
-
356
-
357
-
358
-
359
-
360
-
361
-
362
-
363
-
364
-
365
-
366
-
367
-
368
-
369
-
370
-
371
-
372
-
373
-
374
-
375
-
376
-
377
-
378
-
379
-
380
-
381
-
382
-
383
-
384
-
385
-
386
-
387
-
388
-
389
-
390
-
391
-
392
-
393
-
394
-
395
-
396
-
397
-
398
-
399
-
400
-
401
-
402
-
403
-
404
-
405
-
406
-
407
-
408
-
409
-
410
-
411
-
412
-
413
-
414
-
415
-
416
-
417
-
418
-
419
-
420
-
421
-
422
-
423
-
424
-
425
-
426
-
427
-
428
-
429
-
430
-
431
-
432
-
433
-
434
-
435
-
436
-
437
-
438
-
439
-
440
-
441
-
442
-
443
-
444
-
445
-
446
-
447
-
448
-
449
-
450
-
451
-
452
-
453
-
454
-
455
-
456
 |
 |

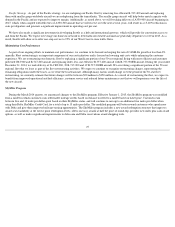
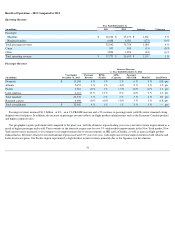
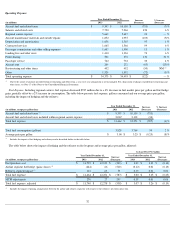
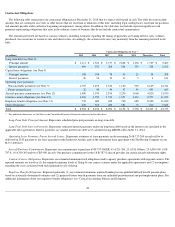
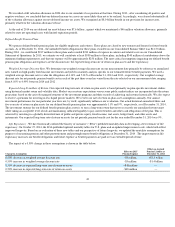
Non-Operating Results
The decline in interest expense, net is driven by reduced levels of debt and the refinancing of debt obligations at lower interest rates. Our principal
amount of debt and capital leases has declined from $14.4 billion at the beginning of 2012 to $9.9 billion at December 31, 2014 .
In each of 2014 and 2012, we extinguished $1.6 billion of existing debt under our secured financing arrangements prior to scheduled maturity. In
connection with the extinguishment, we recorded losses of $268 million and $118 million , respectively, for the difference between the principal paid
and the carrying value of the debt, which included unamortized discounts or premiums and unamortized issuance costs. The unamortized debt
discounts resulted from fair value adjustments recorded in the 2008 purchase accounting of Northwest Airlines. The losses also included premiums
paid to retire the debt.
Miscellaneous, net is unfavorable primarily due to our proportionate share of losses from our equity investment in Virgin Atlantic, foreign currency
exchange rate losses and a charge associated with the devaluation of the Venezuelan bolivar. The loss from Virgin Atlantic primarily results from
unfavorable MTM adjustments on fuel hedges.
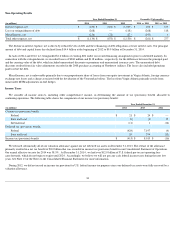
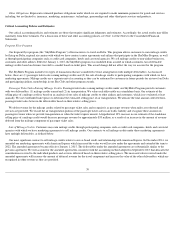
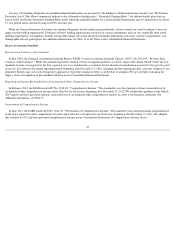
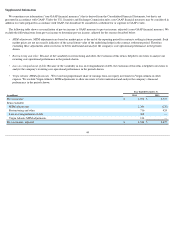
Income Taxes
We consider all income sources, including other comprehensive income, in determining the amount of tax (provision) benefit allocated to
continuing operations. The following table shows the components of our income tax (provision) benefit:
We released substantially all of our valuation allowance against our net deferred tax assets on December 31, 2013. The release of the allowance
primarily resulted in a net tax benefit of $8.0 billion that was recorded in income tax (provision) benefit in our Consolidated Statement of Operations.
Our annual effective tax rate for 2014 was 38.5% . At December 31, 2014 , we had over $12.0 billion of U.S. federal pre-tax net operating loss
carryforwards, which do not begin to expire until 2024 . Accordingly, we believe we will not pay any cash federal income taxes during the next few
years. See
Note 13 of the Notes to the Consolidated Financial Statements for more information.
During 2012, we did not record an income tax provision for U.S. federal income tax purposes since our deferred tax assets were fully reserved by a
valuation allowance.
34
Year Ended December 31,
Favorable (Unfavorable)
(in millions) 2014 2013 2012
2014 vs. 2013 2013 vs. 2012
Interest expense, net
$
(650
)
$
(852
)
$
(1,005
)
$
202
$
153
Loss on extinguishment of debt
(268
)
—
(
118
)
(268
)
118
Miscellaneous, net
(216
)
(21
)
(27
)
(195
)
6
Total other expense, net
$
(1,134
)
$
(873
)
$
(1,150
)
$
(261
)
$
277
Year Ended December 31,
(in millions) 2014 2013 2012
Current tax (provision) benefit:
Federal
$
21
$
24
$
—
State and local
(9
)
(3
)
15
International
(11
)
1
(14
)
Deferred tax (provision) benefit:
Federal
(424
)
7,197
(4
)
State and local
10
794
(13
)
Income tax (provision) benefit
$
(413
)
$
8,013
$
(16
)