Dell 2002 Annual Report Download - page 54
Download and view the complete annual report
Please find page 54 of the 2002 Dell annual report below. You can navigate through the pages in the report by either clicking on the pages listed below, or by using the keyword search tool below to find specific information within the annual report.-
 1
1 -
2
-
3
-
4
-
5
-
6
-
7
-
8
-
9
-
10
-
11
-
12
-
13
-
14
-
15
-
16
-
17
-
18
-
19
-
20
-
21
-
22
-
23
-
24
-
25
-
26
-
27
-
28
-
29
-
30
-
31
-
32
-
33
-
34
-
35
-
36
-
37
-
38
-
39
-
40
-
41
-
42
-
43
-
 44
44 -
 45
45 -
 46
46 -
 47
47 -
 48
48 -
 49
49 -
 50
50 -
 51
51 -
 52
52 -
 53
53 -
 54
54 -
 55
55 -
 56
56 -
 57
57 -
 58
58 -
 59
59 -
 60
60 -
 61
61 -
 62
62 -
 63
63 -
 64
64 -
65
-
66
-
67
-
68
-
69
-
70
-
71
-
72
-
73
-
74
-
75
-
76
-
77
-
78
-
79
-
80
-
81
-
82
-
83
-
84
-
85
-
86
-
87
-
88
-
89
-
90
-
91
 |
 |

Table of Contents
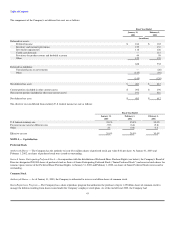
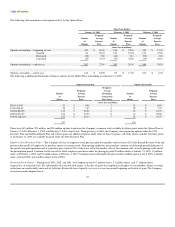
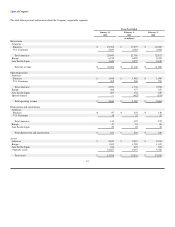
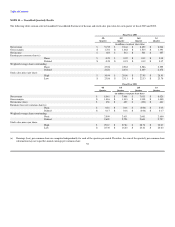
The table below presents information about the Company's reportable segments.
Fiscal Year Ended
January 31, February 1, February 2,
2003 2002 2001
(in millions)
Net revenue
Americas:
Business $ 19,394 $ 17,275 $ 18,969
U.S. Consumer 5,653 4,485 3,902
Total Americas 25,047 21,760 22,871
Europe 6,912 6,429 6,399
Asia Pacific-Japan 3,445 2,979 2,618
Total net revenue $ 35,404 $ 31,168 $ 31,888
Operating income
Americas:
Business $ 1,945 $ 1,482 $ 1,999
U.S. Consumer 308 260 253
Total Americas 2,253 1,742 2,252
Europe 388 377 347
Asia Pacific-Japan 203 152 169
Special charges — (482) (105)
Total operating income $ 2,844 $ 1,789 $ 2,663
Depreciation and amortization
Americas:
Business $ 97 $ 125 $ 130
U.S. Consumer 38 32 27
Total Americas 135 157 157
Europe 47 54 60
Asia Pacific-Japan 29 28 23
Total depreciation and amortization $ 211 $ 239 $ 240
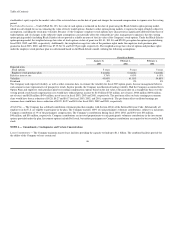
Assets
Americas $ 2,847 $ 2,319 $ 2,553
Europe 1,302 1,220 1,167
Asia Pacific-Japan 634 499 524
Corporate assets 10,687 9,497 9,426
Total assets $ 15,470 $ 13,535 $ 13,670
51